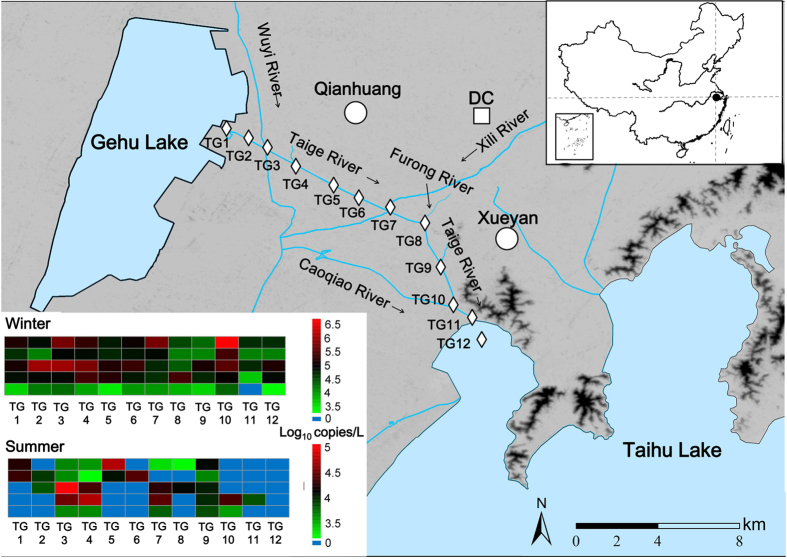
Figure 3. Map of the sampling sites along Taige River with a heatmap of the concentrations of the human-associated DNA markers at each sampling site.
The map was created using ArcGIS 10.0 (http://www.esrichina-bj.cn/softwareproduct/ArcGIS/). The rhombus refers to sampling site, the square refers to sewage water treatment plant, and the circle refers to town.

