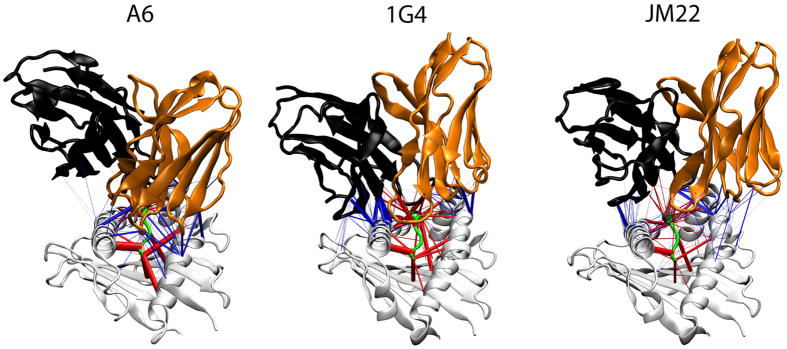
Figure 1. Predicted hydrogen bonds at the TCR/pMHC contact interface.
The existence of hydrogen bonds between the indicated TCRs (Vα domain orange, Vβ domain black) and HLA-A2 (grey) presenting peptides (green) as predicted by molecular dynamics simulations (see Methods). Predicted hydrogen bonds involving TCR/MHC and TCR/peptide are represented by blue and red lines, respectively, with the line thickness proportional to the time the hydrogen bond was present. The HLA-A2 α1 and α2-helices are on the left and right of each structure, respectively.

