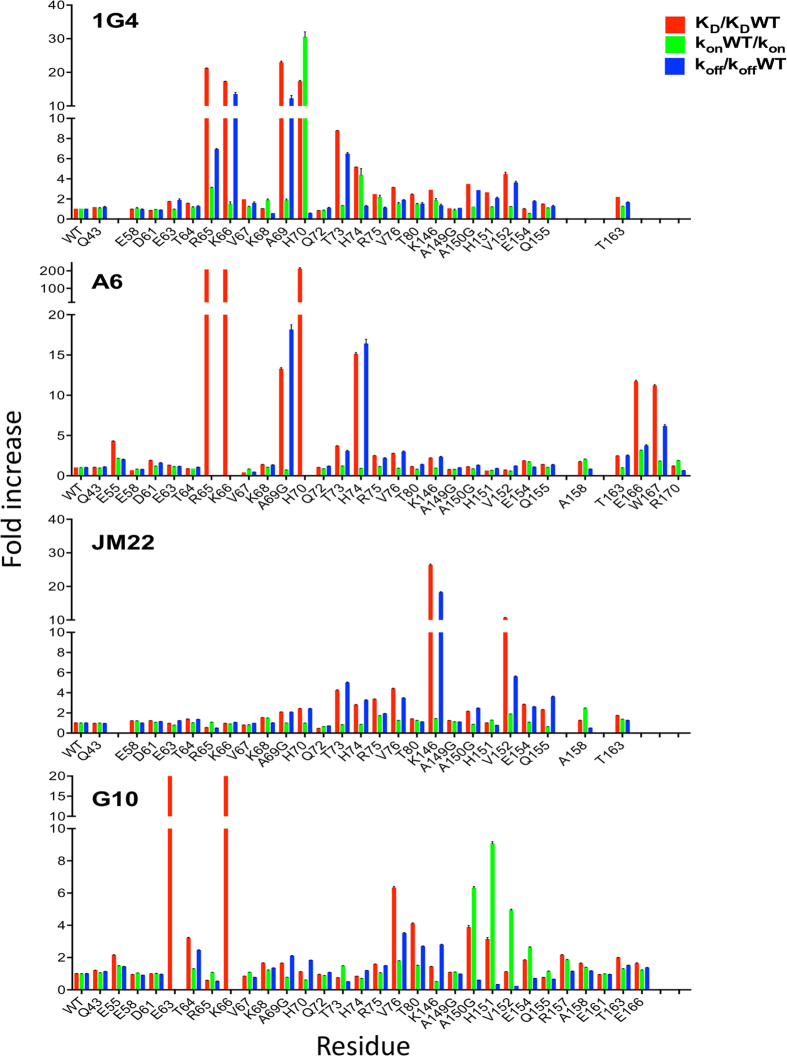
Figure 2. Binding properties of 1G4, A6, JM22 and G10 TCRs to the indicated HLA-A2 mutants.
The KD, kon, and koff of TCRs binding to the indicated HLA-A2 mutants, relative to binding to WT HLA-A2. These data are from Tables S1–4. The error bars represent range or SD from at least two independent SPR measurements.

