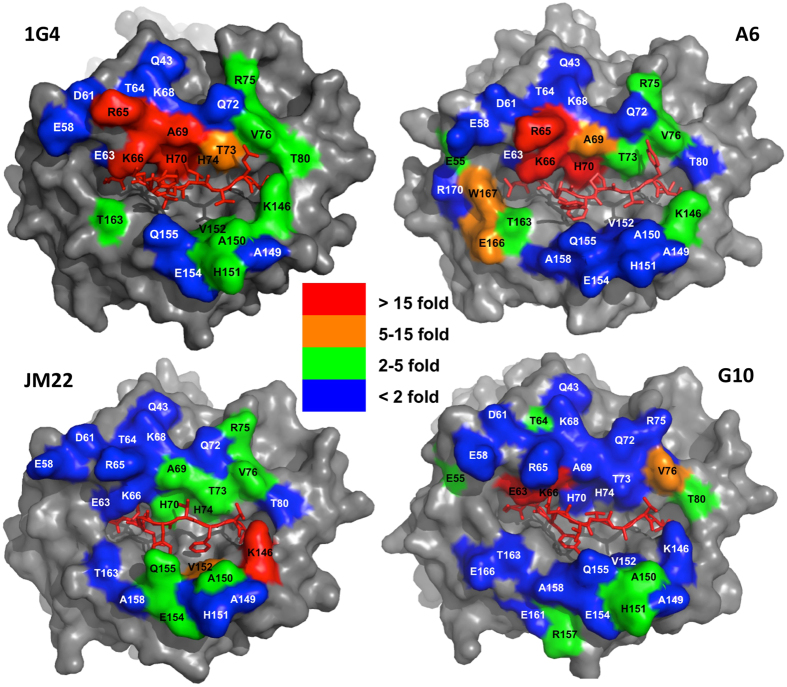
Figure 3. Energetic footprint of HLA-A2 restricted TCRs.
Energetic footprints of the indicated TCRs on HLA-A2 presenting the appropriate cognate peptide. The residues are coloured according to the indicated fold-increase in KD for the TCR binding the mutant compared with wild-type. HLA-A2 is shown with solid grey or coloured surfaces and the peptides as red stick models.

