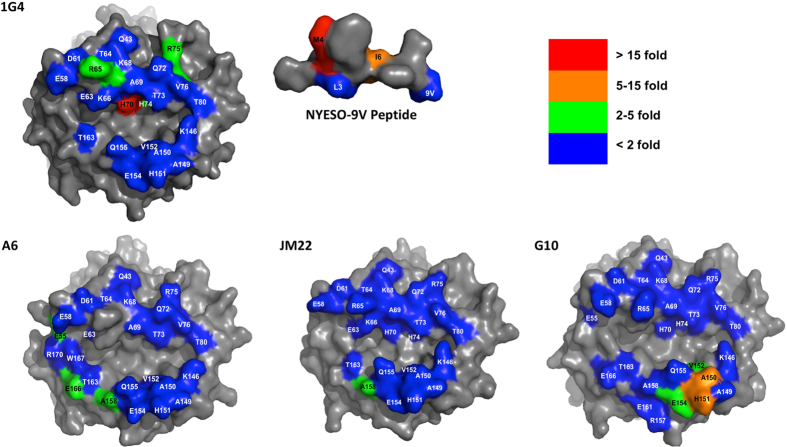
Figure 7. Kinetic footprints of HLA-A2 restricted TCRs.
Kinetic footprints of the indicated TCRs (1G4, A6, JM22 and G10). The residues on HLA-A2 that were mutated are coloured according to the indicated fold decrease in kon of the mutant compared with wild-type. The NYESO-9V peptide residues are similarly coloured. Residues not mutated, or mutation of which was uninformative, are in gray.

