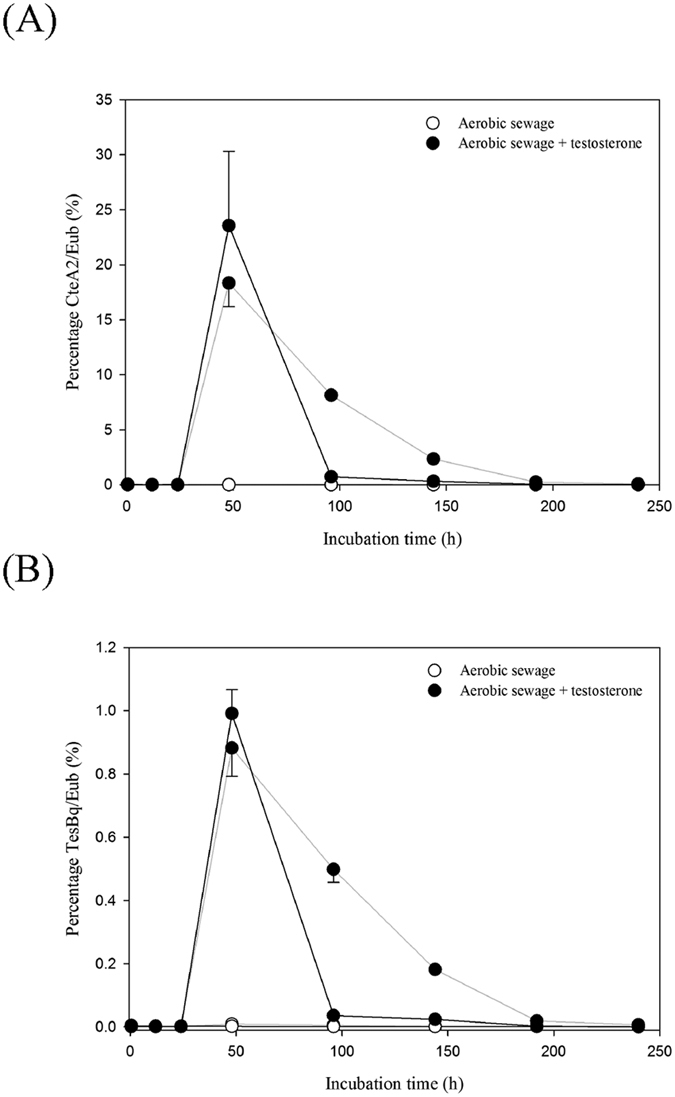
Figure 6.

Real-time quantitative PCR indicated the temporal changes in the C. testosteroni 16S rRNA (A) and tesB (B) gene copies in the testosterone-treated sewage. Relative abundance of individual C. testosteroni genes was calculated as a proportion of the total number of bacterial 16S rRNA gene copies. Sewage treatments were performed in duplicate and the grey (Replicate 1) and black (Replicate 2) lines represent different replicates. Data are shown as the mean ± SE of three experimental measurements. Primer pairs CteA2, TesBq, and Eub were used to amplify the 16S rRNA and tesB genes of C. testosteroni as well as total eubacterial population, respectively. Real-time quantitative PCR standard curves obtained using the three primer pairs are shown in Fig. S11.
