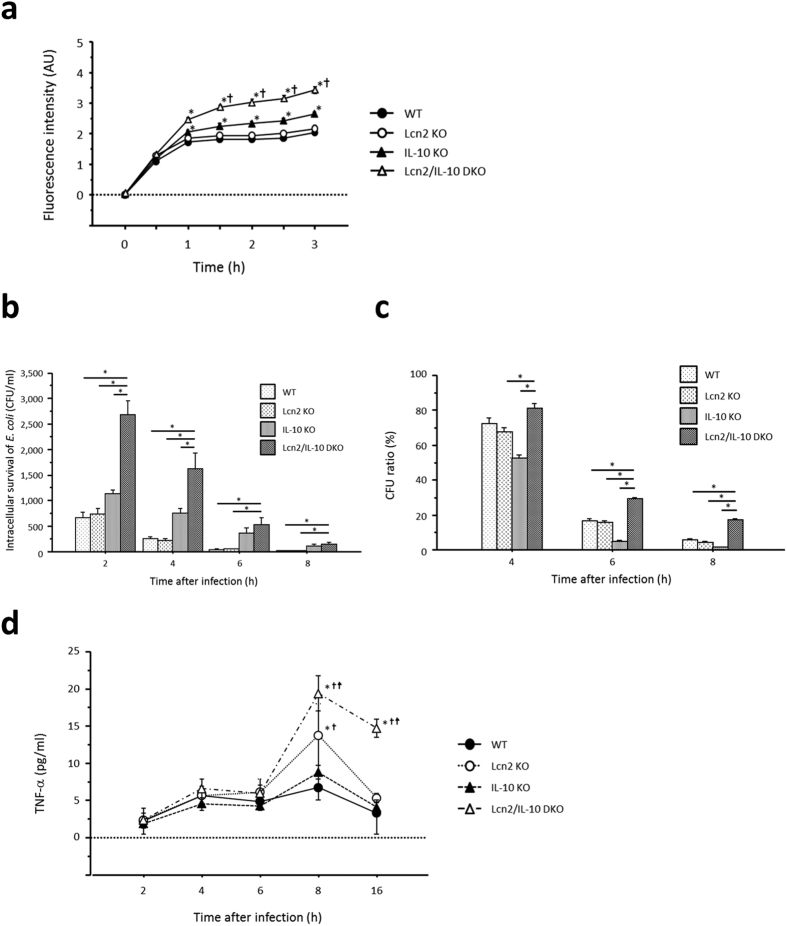
Figure 5. Involvement of Lcn2 in phagocytosis and intracellular bacterial clearance in IL-10 KO mouse-derived macrophages.
(a) Time-dependent changes in fluorescence intensity in thioglycollate-elicited peritoneal macrophages challenged with fluorescent particle conjugated-E. coli. Fluorescence intensity was measured at the indicated times and is shown in arbitrary units (AU). N = 9 per group. Error bars represent SEM. *P < 0.05 compared with WT mice; †P < 0.05 compared with IL-10 KO mice by one-way ANOVA with Bonferroni’s correction. (b) Intracellular survival of E. coli in macrophages at the indicated times after infection. N = 6 per group. Error bars represent SEM. *P < 0.05, one-way ANOVA with Bonferroni’s correction. (c) Ratio of colony forming units (CFU) at the indicated times to CFU at 2 hours after E. coli infection. N = 6 per group. Error bars represent SEM. *P < 0.05, one-way ANOVA with Bonferroni’s correction. (d) TNF-α secretion from macrophages after infection with E. coli. N = 6 per group. Error bars represent SEM. *P < 0.05 compared with WT mice; †P < 0.05 compared with IL-10 KO mice; ‡P < 0.05 compared with Lcn2 KO mice by one-way ANOVA with Bonferroni’s correction.

