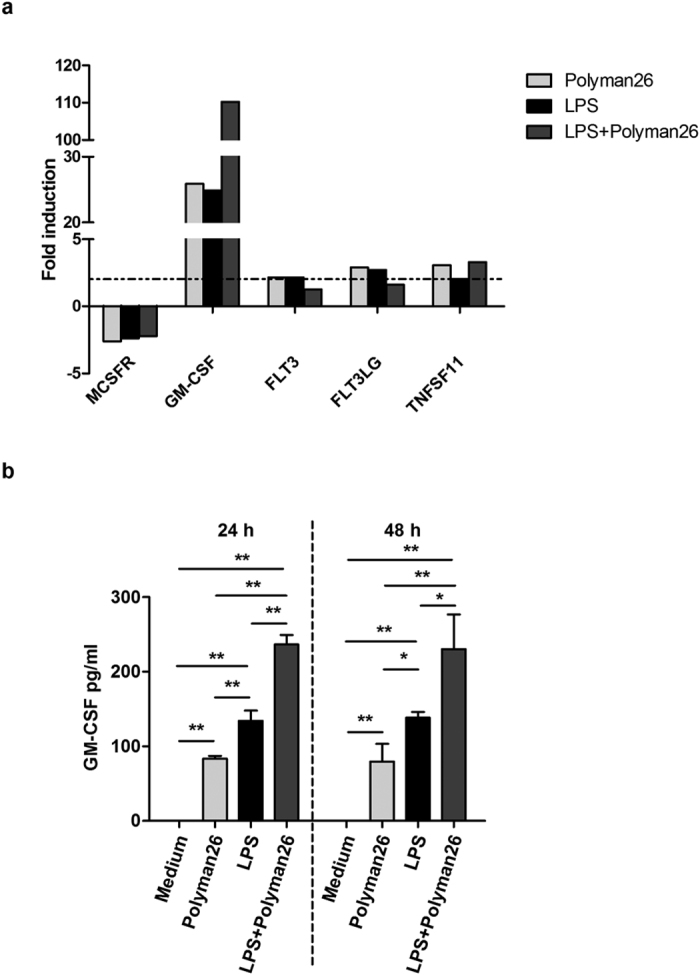
Figure 8. Expression of homeostatic cytokines and receptors.

iMDDCs from 4 separate donors were treated with medium culture, Polyman26 (10 μM), LPS (1 μg/ml), or Polyman26+ LPS for 3, 24, and 48 h. (a) Gene expression following 3 h treatment. For each condition, cDNA was pooled and gene expression evaluated by Real-time PCR array. Expression was normalized to 5 housekeeping genes and shown as fold induction relative to unstimulated control. Targets showing at least a 2-fold modulation were considered significant. (b) The concentration of GM-CSF in the culture supernatants was assayed by ELISA at 24 and 48 h. Values represent the mean ± SD. *p < 0.05; **p < 0.01 (Student’s t-test).
