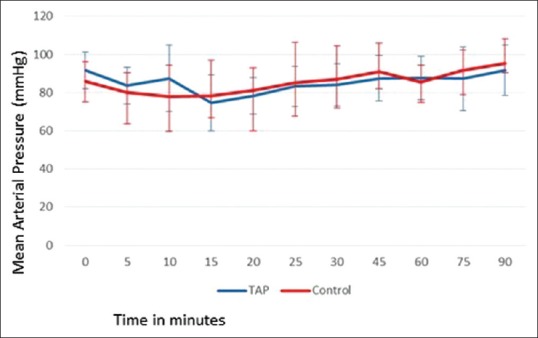
Figure 4.

Intraoperative mean arterial pressure (mmHg) (mean ± standard deviation) (y axis) in patients in the two groups. P<0.05 was considered to be statistically significant (x axis-time in minutes)

Intraoperative mean arterial pressure (mmHg) (mean ± standard deviation) (y axis) in patients in the two groups. P<0.05 was considered to be statistically significant (x axis-time in minutes)