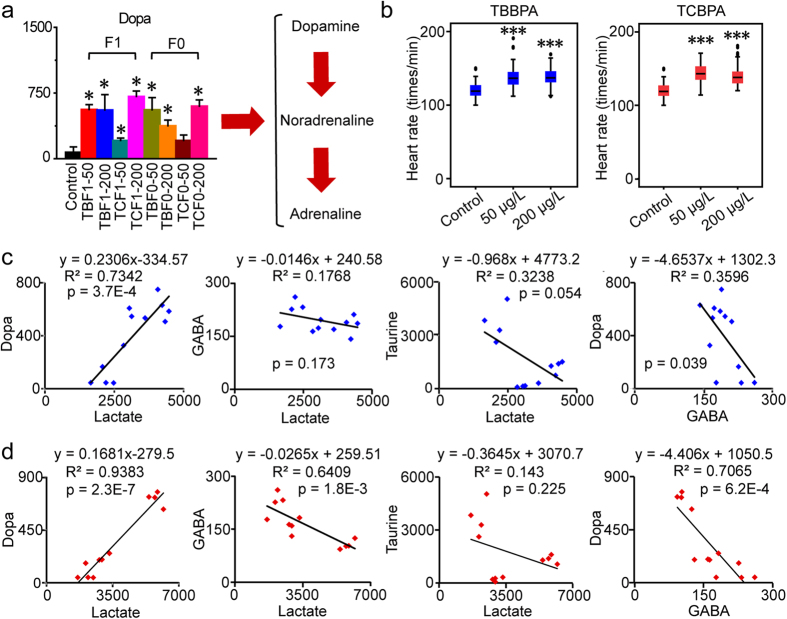
Figure 4. Disorders of neural system in response to H-BPA exposure.
(a) Disorders of the dopamine pathway in response to H-BPA exposure. Dopa levels are represented as the mean + sd. *p < 0.05, n = 4, two-tailed Mann-Whitney U test. (b) Disorders of heart rates in response to H-BPA exposure. *p < 0.05; ***p < 0.001, n = 67–80, two-tailed Mann-Whitney U test. (c) Associations between neurotransmitters and lactate in response to TBBPA exposure. Data are from the control and treatment groups (n = 12). (d) Associations between neurotransmitters and lactate in response to TCBPA exposure. Data are from the control and treatment groups (n = 12).

