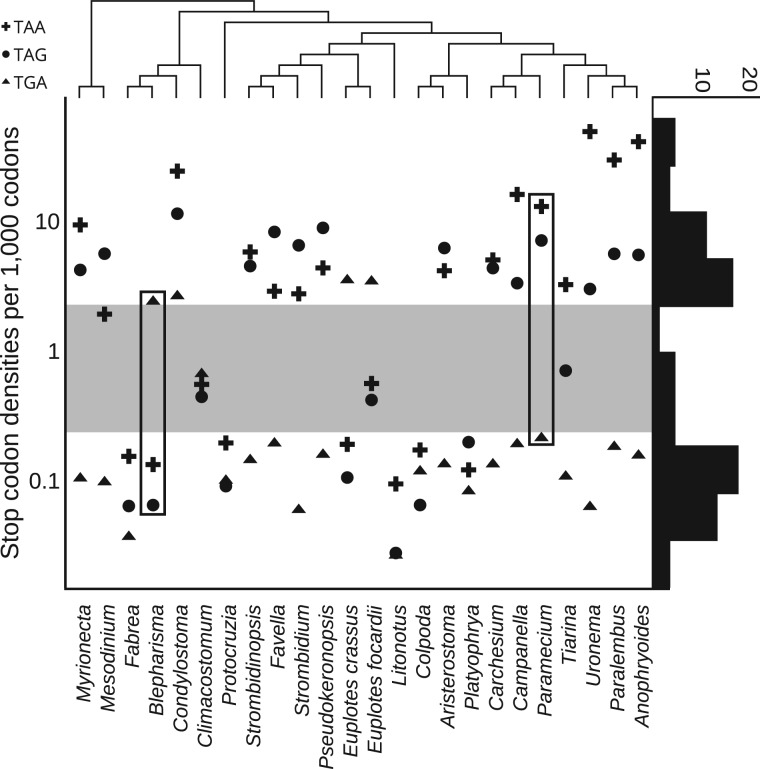
Fig. 1.
Classification of ciliate stop codons. Stop codon densities (axis y) in protein coding sequences are indicated for each species (bottom). Rectangles specify stop codons of the organisms used for defining a threshold (gray area) for discriminating reassigned codons (above gray area) from those that retained their function as signals for termination (below gray area). The phylogenetic tree constructed with 18S rRNA sequences above indicates the relatedness of each species. The histogram on the right shows distribution of stop codon densities.

