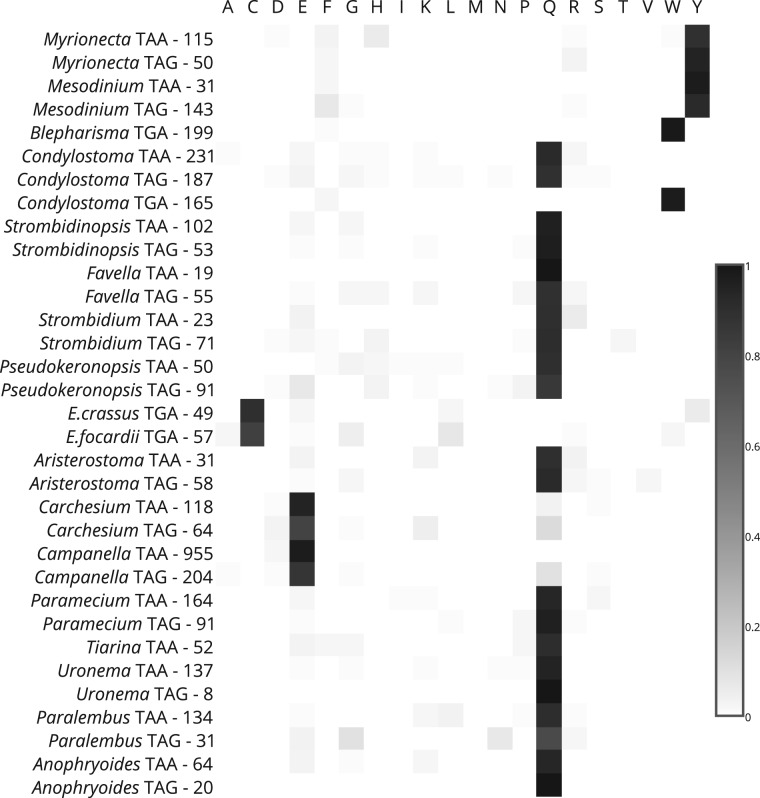
Fig. 2.
Identification of amino acid specifications of the reassigned codons. Each row corresponds to a single reassigned codon. The organism, the codon identity and the total number of occurrences at highly conserved positions of aligned sequences are indicated on the left. The normalized frequencies of amino acid substitutions are shown as heatmaps.

