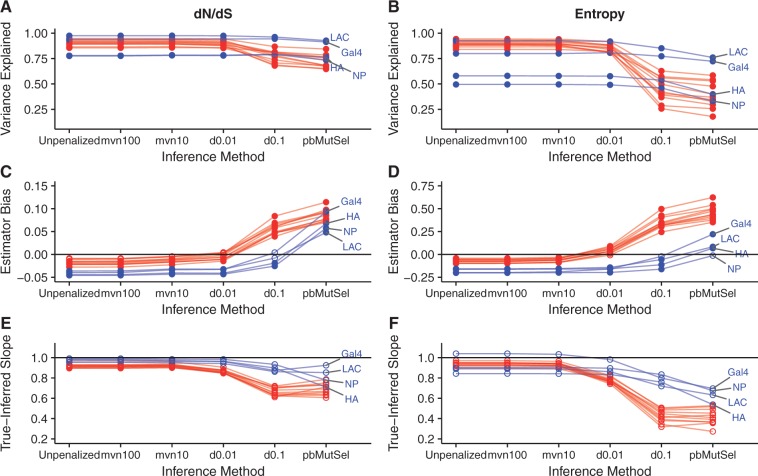
Fig. 4.
Performance of mutation--selection model inference platforms on simulations with branch lengths of 0.5. Labeled points correspond to DMS simulations. (A and B) r2 between true and inferred dN/dS (A) and entropy (B) across inference methods, for all simulated data sets. (C and D) Estimator bias of inference methods relative to true dN/dS (C) and entropy (D) values, for all simulated data sets. Open points indicate biases that were not significantly different from 0 (Bonferroni-corrected P > 0.05, test for intercept in linear model), and solid points indicate biases that were significantly different from 0 (Bonferroni-corrected P < 0.05). The straight line indicates an estimator bias of 0, meaning an unbiased predictor. Note that panels (C and D) use different y-axis ranges, due to the different scales between dN/dS and entropy. (E and F) Slope for the linear relationship of inferred regressed on true dN/dS (E) and entropy (F) values. Open points indicate slopes that were not significantly different from 1 (Bonferroni-corrected P > 0.05, test for slope in linear model not equal to 1), and solid points indicate biases that were significantly different from 1 (Bonferroni-corrected P < 0.05). The straight line indicates the null slope of 1. A corresponding figure for simulations using branch lengths of 0.01 is in supplementary figure S7, Supplementary Material online.

