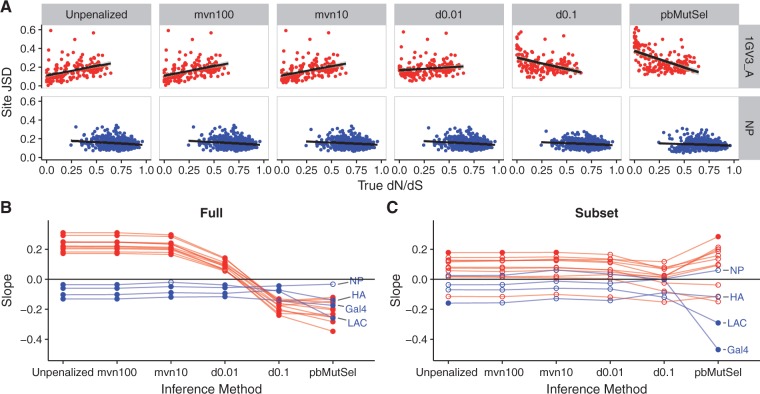
Fig. 5.
The site-specific Jensen–Shannon distance between true and inferred amino-acid frequencies depends both on selective constraint and inference method. Results are shown for simulations with branch lengths of 0.5. Labeled points correspond to DMS simulations. (A) Site JSD regressed on true site dN/dS. The line in each panel indicates the linear regression line. (B) Slope of relationship shown in panel (A) for all simulated data sets. (C) Slope of relationship shown in panel (A) for all simulated data sets, considering only a subset of sites whose true dN/dS falls in the range . For panels (B) and (C), the straight line indicates the y = 0 line, meaning no linear relationship between JSD and dN/dS. Open points indicate slopes that were not significantly different from 0 (Bonferroni-corrected P > 0.05), and solid points indicate slopes that were significantly different from 0 (Bonferroni-corrected P < 0.05).

