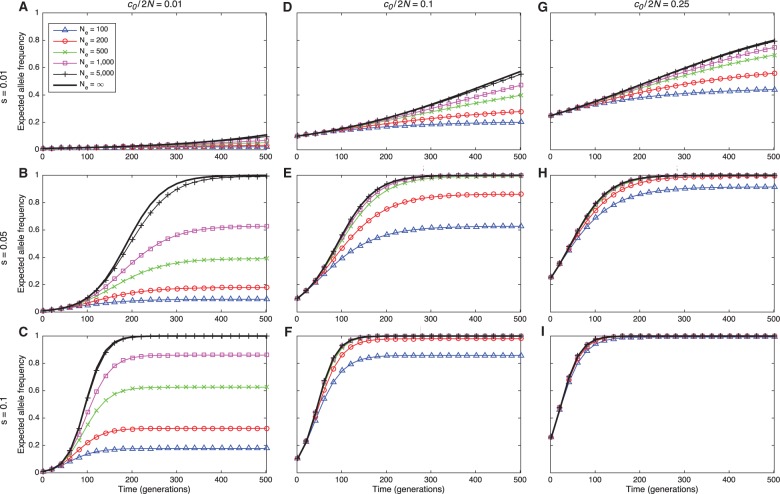
Fig. 2.
Expected Wright–Fisher trajectories of allele A for different initial starting counts c0, selection coefficients s, and effective population sizes N. Columns correspond to different initial starting frequencies with and 0.25. The dominance parameter is set to h = ½ in all panels. Because the effects of mutation are negligible during the time periods we consider, we set .

