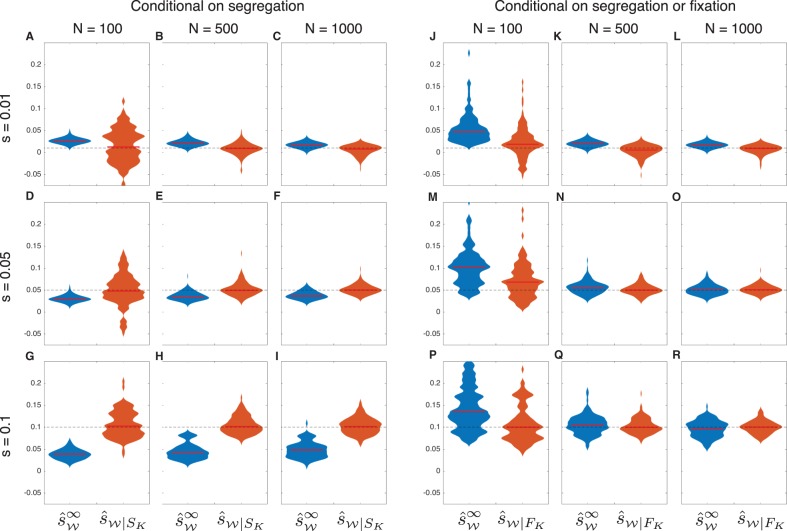
Fig. 5.
Estimates of selection coefficients, conditional on segregation. Each violin plot was computed using 100 frequency trajectories sampled over 500 generations for an allele with initial frequency . As in figure 3, samples of size n = 50 were taken in generations 50, 100, 150, 200, 250, 300, 350, 400, 450, and 500. In Panels A–I, trajectories were sampled conditional on the event that the selected allele was segregating in the final sample. In Panels J–R, trajectories were sampled conditional on the event that the selected allele was either segregating or fixed in the final sample. Red bars indicate medians. Dashed lines indicate the true selection coefficients. The maximum width of each violin plot is scaled to the same value for both estimators.

