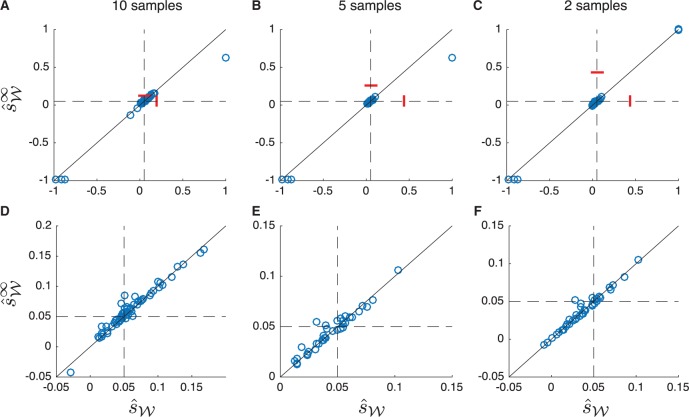
Fig. 7.
Scatter plots comparing the estimates and when the initial allele frequency is unspecified during inference. One hundred allele frequency trajectories were simulated for 500 generations with s = 0.05, N = 100, and y0 sampled uniformly from the interval as described in the “Simulations” section. Estimates and were computed using Procedures 1 and 2 using the modified procedure taken when and y0 are unspecified. (A) Estimates computed using all ten samples of size n = 50 taken in generations , and 500. (B) Estimates computed using the five samples taken in generations , and 450. (C) Estimates computed using the two samples taken in generations 50 and 150. (D), (E), and (F) are zoomed-in versions of the plots in (A), (B), and (C). All panels correspond to the same 100 simulated trajectories. Dashed lines correspond to the true selection coefficient. Bars show means over all 100 estimates. The solid line is .

