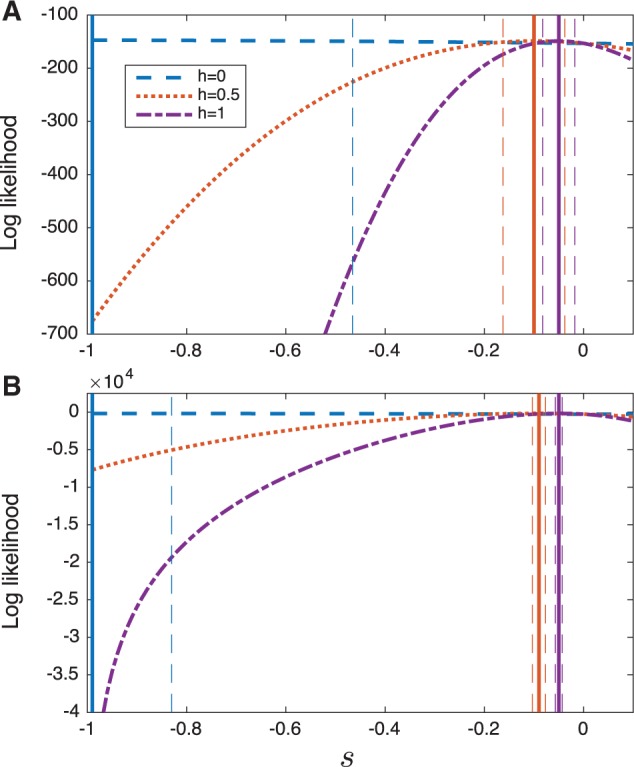
Fig. 8.

The log likelihood as a function of s computed using Procedures 1 and 3 for three different values of the dominance parameter h (). Solid vertical lines show the maximum likelihood estimates, in (A) and in (B), for the curve of the corresponding color. Dashed vertical lines indicate asymptotic normal approximations of the 95% confidence intervals for s, for the curve of the corresponding color. (A) The demography-aware likelihoods (Procedure 1). (B) The deterministic likelihoods (Procedure 3).
