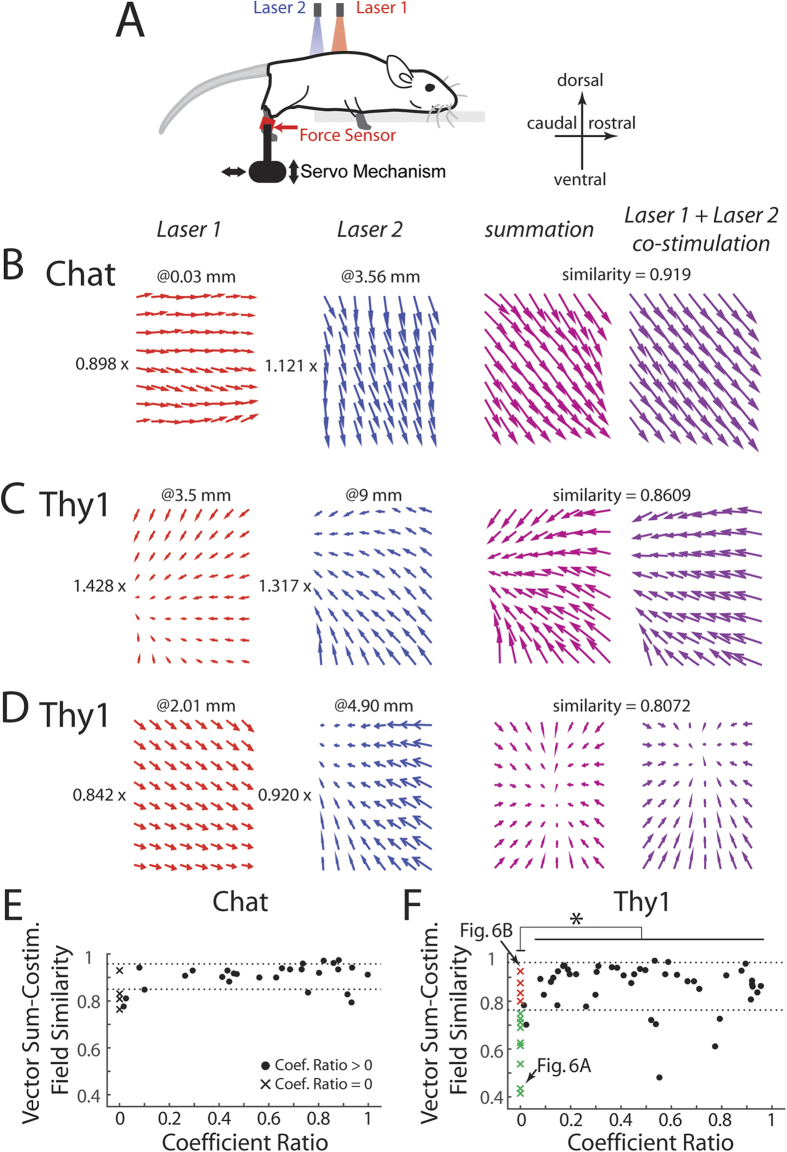
Figure 5. Optogenetically evoked fields in both Thy1 and Chat displayed linear combination.
(A) To assess whether the property of linear combination holds for force fields optogenetically derived, we elicited force fields with co-stimulation from two laser beams, placed at separate spinal loci. (B) An example from a Chat mouse showing how the force field produced by co-stimulation (rightmost panel) can be reconstructed by linearly combining the force fields separately evoked at the individual loci (laser 1 and laser 2). The coefficients for this linear combination, shown to the left of the individual fields, were found by linear regression. The locations of the spinal stimulation loci, measured in mm with respect to the anterior edge of the T12 vertebra, are shown on top of the individual force fields. Similarity between the reconstructed and co-stimulation force fields was quantified using equation (5) stated in Methods. (C,D) Two examples from two different Thy1 mice demonstrating how spinal force fields could be linearly combined to explain fields derived from co-stimulation. (E,F) Similarity between the reconstructed and co-stimulation force fields was plotted against the coefficient ratio, defined as the smaller of the two combination coefficients divided by the larger coefficient, for the Chat (panel E) and Thy1 (panel F) mice, respectively. A coefficient ratio of 0 (x) implies that a “winner-take-all” model produces a better fit. Importantly, considering the cases with coefficient ratio > 0 (•), the average similarity values for the Chat and Thy1 were not significantly different from each other (p > 0.05). Also, in both mouse strains, when the coefficient ratio was > 0, similarity was not dependent on the coefficient ratio (p > 0.05), further suggesting the generality of the linear-combination model of force-field modules. In Thy1 (panel F), when coefficient ratio = 0, some co-stimulation fields were well explained by the winner (red x), but others were explained poorly (green x). Horizontal dotted lines mark mean ± SD of the similarity values for cases with coefficient ratio > 0. In (F) two specific data points with a coefficient ratio of 0 (marked with arrows) are shown in Fig. 6 as examples of winner-take-all.

