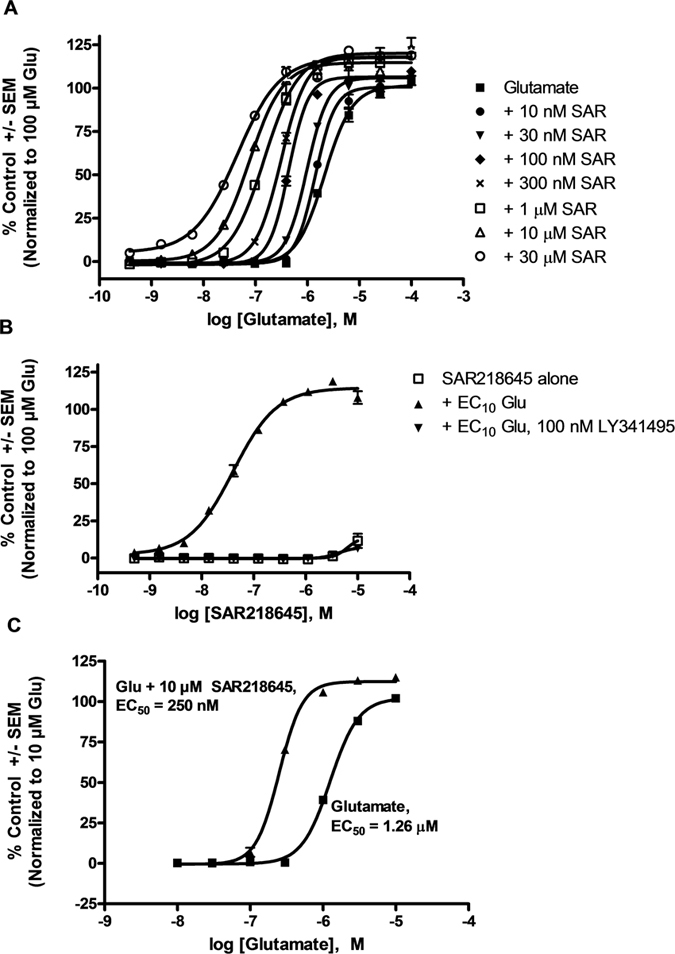
Figure 2.

(A,C) Concentration-response curves for glutamate in the absence or in the presence of increasing concentrations of SAR218645 (SAR) in cell lines expressing rat mGluR2 and human mGluR2, respectively. (B) Concentration-response curve of SAR218645 in the presence of a submaximal concentration (EC10) of glutamate (Glu) in HEK293 cells stably expressing rat mGluR2 on Ca2+ mobilization. Antagonism of this effect by the mGluR2/3 receptor antagonist, LY341495. The fluorescence responses were normalized as a percentage of the maximal response to glutamate (10 or 100 μM) and represent the means ± S.E.M.
