FIGURE 7.

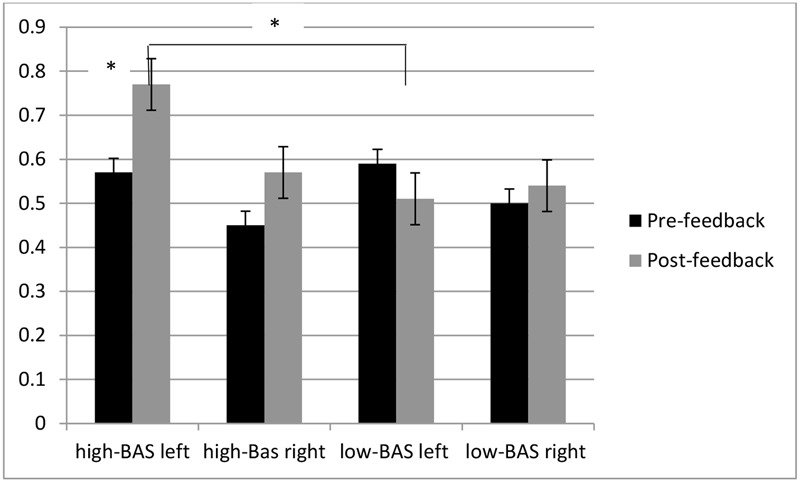
O2Hb modulation ad a function of BAS and Condition. High-BAS showed increased left response for in post-feedback than pre-feedback condition and compared to low-BAS in post-feedback condition. Asterisk indicates significant differences.

O2Hb modulation ad a function of BAS and Condition. High-BAS showed increased left response for in post-feedback than pre-feedback condition and compared to low-BAS in post-feedback condition. Asterisk indicates significant differences.