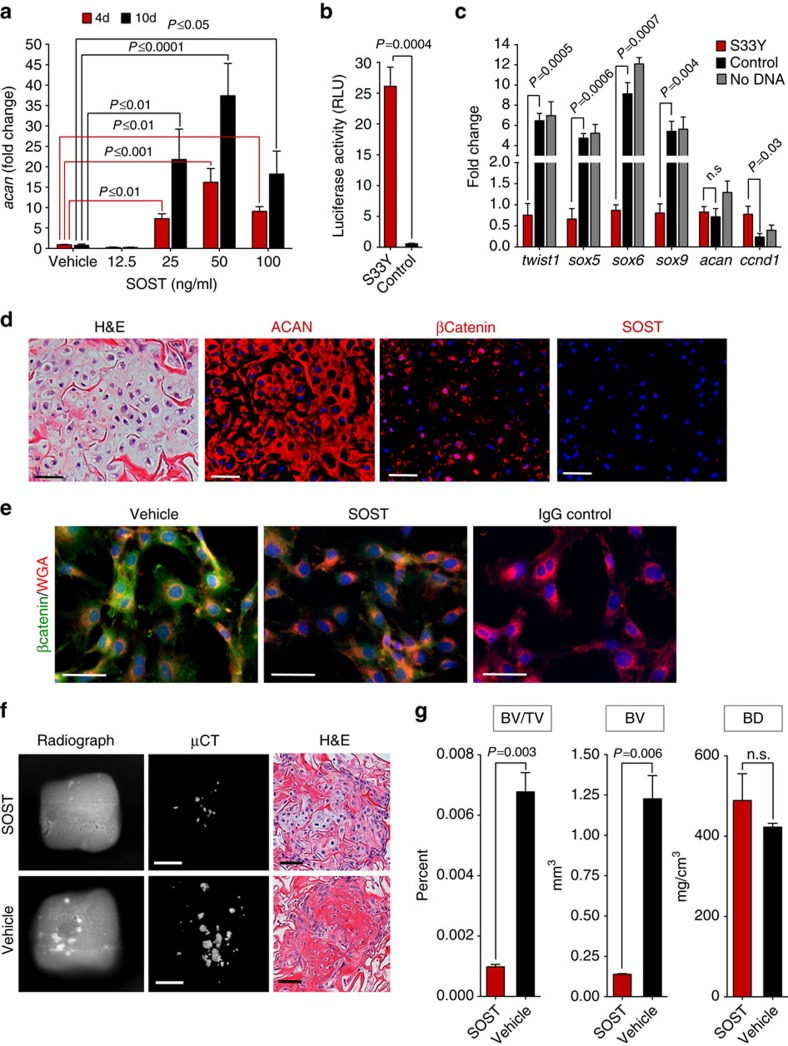
Figure 4. FCSCs differentiate into chondrocytes and maintain tissue homeostasis through inhibited Wnt.
(a) qRT-PCR show sclerostin induced aggrecan in FCSCs dose-dependently. Data are mean fold change normalized to GAPDH±s.d.; n=3 independent experiments; two-way ANOVA followed by Tukey's post hoc. (b) FCSCs were transfected with luciferase reporter TopFlash and constitutively active βCateninS33y plasmid or control vector. Luciferase activity reported at 72 h. Data are mean±s.d.; n=4 independent experiments; paired Student's t-test. (c) qRT-PCR shows S33y FCSCs have decreased cartilage-related genes and increase in Wnt-related gene. Data are mean normalized to GAPDH±s.d.; n=4 independent experiments; paired Student's t-test. (d) Transplanted FCSCs showed aggrecan (ACAN) and βCatenin, but no SOST expression at 3 weeks. Scale bar, 50 μm. (e) Representative immunocytochemistry staining show decreased intracellular βCatenin in sclerostin treated FCSCs (50 ng ml−1) for 48 h. Scale bar, 50 μm. (f) FCSCs were treated with sclerostin (50 ng ml−1) or vehicle for 48 h and transplanted within collagen sponge in nude mice for 6 weeks. Radiographs, uCT and H&E of transplants showed cartilage was maintained and less bone formed in sclerostin treated FCSCs. White scale bar, 2 mm. Black scale bar, 50 μm. (g) Bone volume/tissue volume (BV/TV), bone volume (BV) and bone density (BD) in transplants seeded with FCSCs treated with sclerostin after 6 weeks. Data are mean±s.d.; n=3 transplants; paired Student's t-test. ANOVA, analysis of variance; H&E, haematoxylin and eosin; qRT-PCR, quantitative real-time PCR.

