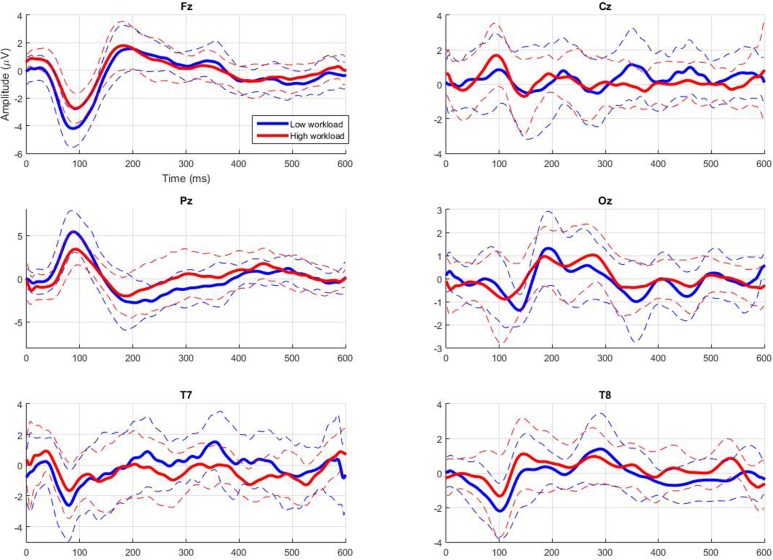
FIGURE 4.
Grand average (in bold) and standard deviation (dotted line) of the auditory evoked potentials (AEPs) elicited by the ignored infrequent auditory probes depending on workload condition at major midline electrode sites (Fz, Cz, Pz, and Oz), as well as at auditory processing relevant sites (T7 and T8).

