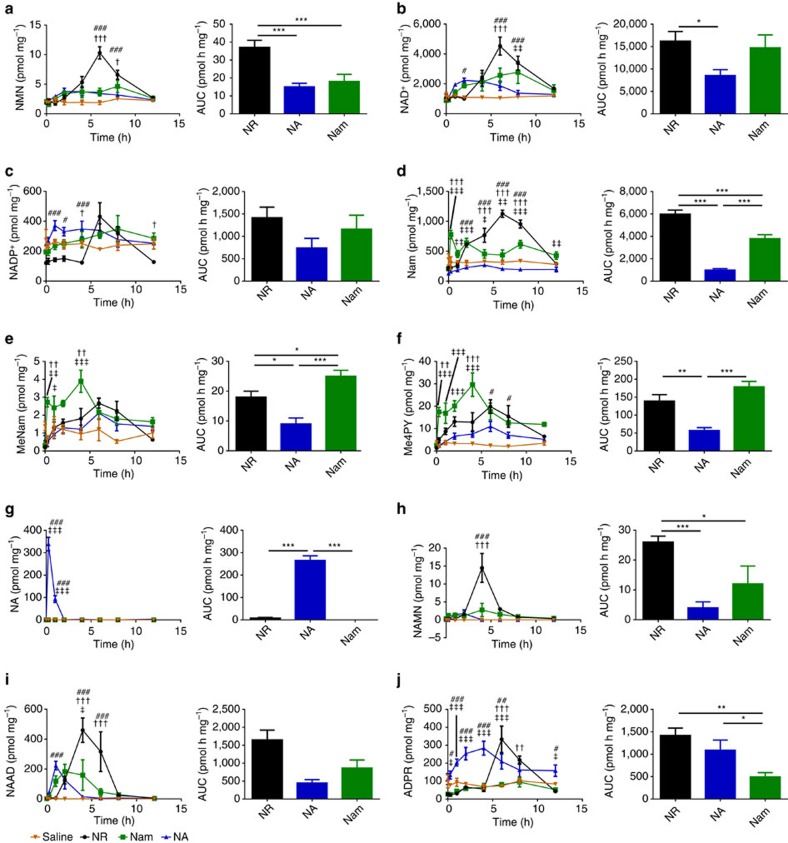
Figure 5. NR elevates hepatic NAD+ metabolism distinctly with respect to other vitamins.
Either saline (orange, n=3 per time point) or equivalent moles of NR (black, n=3 per time point), NA (blue, n=4 per time point) and Nam (green, n=4 per time point) were administered to male C57Bl6/J mice by gavage. To control for circadian effects, gavage was performed at indicated times before a common ∼2 pm tissue collection. In the left panels, the hepatic concentrations (pmol per mg of wet tissue weight) of each metabolite (a, NMN; b, NAD+; c, NADP+; d, Nam; e, MeNam; f, Me4PY; g, NA; h, NAMN; i, NAAD; and j, ADPR) are shown as a function of the four gavages. The excursion of each metabolite as a function of saline gavage is shown in orange; as a function of NR in black; as function of Nam in green; and NA in blue. In the right panels, the baseline-subtracted 12-hour AUCs are shown. (left) ‡P value<0.05; ‡‡P value<0.01; ‡‡‡P value <0.001 Nam versus NA; †P value<0.05; ††P value<0.01; †††P value<0.001 Nam versus NR; #P value<0.05; ##P value<0.01; ###P value<0.05 NA versus NR; (right) *P value<0.05; **P value<0.01; ***P value <0.001. The data indicate that NR produces greater increases in NAD+ metabolism than Nam or NA with distinctive kinetics, that Nam is disadvantaged in stimulation of NAD+-consuming activities, and that NAAD is surprisingly produced after oral NR administration.

