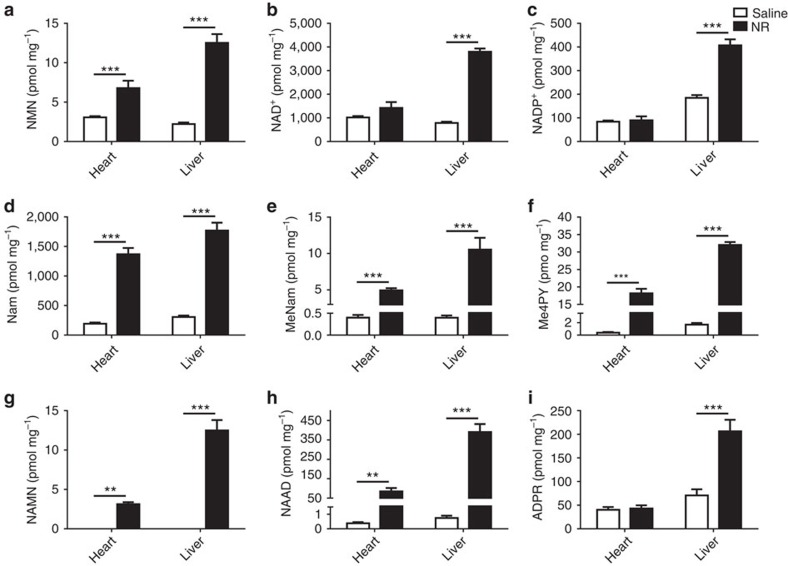
Figure 6. Rising NAAD is a more sensitive biomarker of elevated tissue NAD+ metabolism than is NAD+.
Male C57Bl6/J mice were intraperitoneally injected either saline (n=8) or NR Cl (500 mg kg−1 body weight) (n=6) for 6 days. Livers and hearts were freeze-clamped and prepared for metabolomic analysis. Concentrations of NAD+ metabolites (a, NMN; b, NAD+; c, NADP+; d, Nam; e, MeNam; f, Me4PY; g, NAMN; h, NAAD; i, ADPR) in heart and liver are presented in pmol mg−1 of wet tissue weight. Data were analysed using a two-way analysis of variance followed by a Holm–Sidak multiple comparisons test. *P value<0.05, **P value<0.01, ***P value<0.001. NR strikingly increased NAAD even in the heart, a tissue in which NAD+ metabolism was increased without an increase in steady-state NAD+ concentration.

