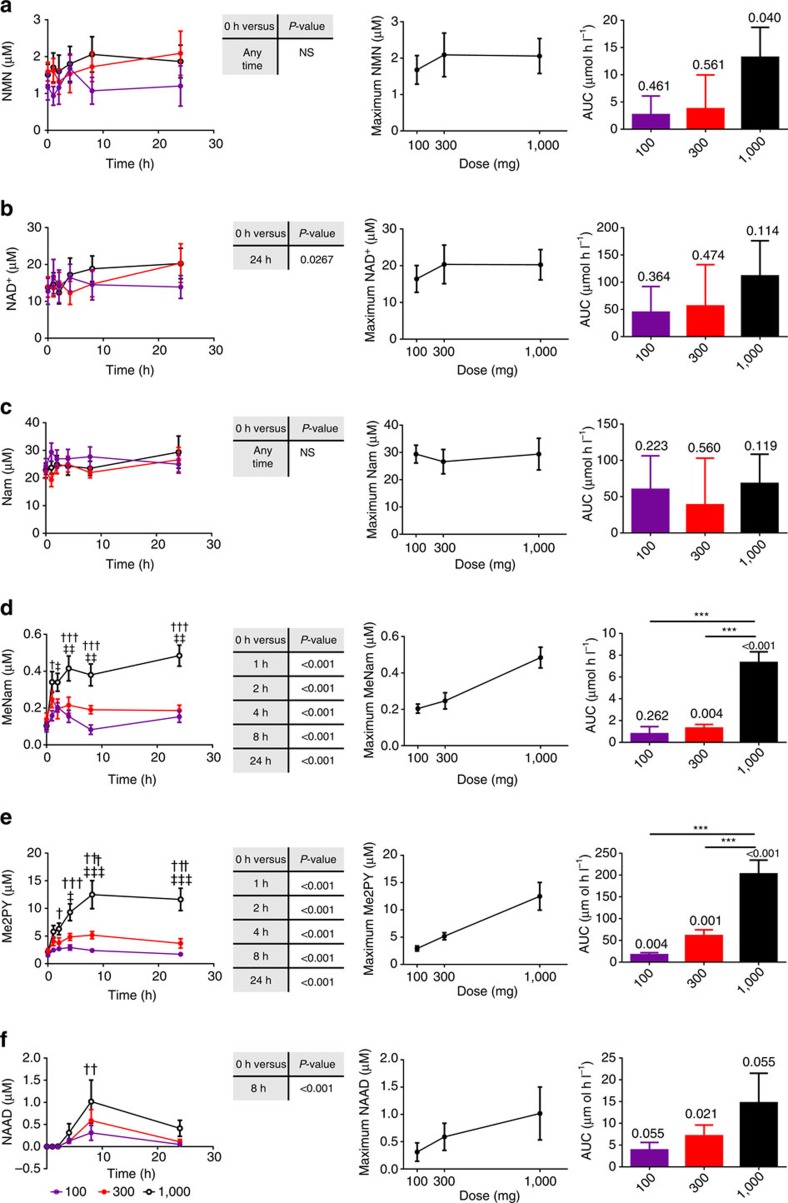
Figure 8. Dose-dependent effects of NR on the NAD+ metabolome of human subjects.
Time-dependent PBMC NAD+ metabolomes from n=12 healthy human subjects were quantified after three different oral doses of NR. In each left panel, the blood concentration of a metabolite as a function of dose and time is displayed (a, NMN; b, NAD+; c, Nam; d, MeNam; e, Me2PY; f, NAAD). #P value<0.05; ##P value<0.01 100 mg versus. 300 mg; ††P value<0.01; †††P value<0.001 100 versus. 1,000; ‡P value<0.05; ‡‡P value<0.01 300 versus. 1,000. A Dunnett's test was performed comparing the average concentration of each metabolite at each time point to the concentration of that metabolite at time zero. Significant elevations of NAD+, MeNam, Me2PY and NAAD are indicated. In each middle panel, the averaged maximum metabolite concentration per dose is plotted. In each right panel, the background-subtracted metabolite AUCs are displayed with a one sample t-test comparing the AUC to background above each bar. In addition, asterisks indicate dose-dependent increases in metabolite AUC (*P value<0.05; **P value<0.01; ***P value<0.001). The data indicate that all doses of NR elevated 8 h NAAD and 24 h NAD+, and that additional NAD+ metabolites were elevated dose dependently with statistical significance by multiple comparisons.

