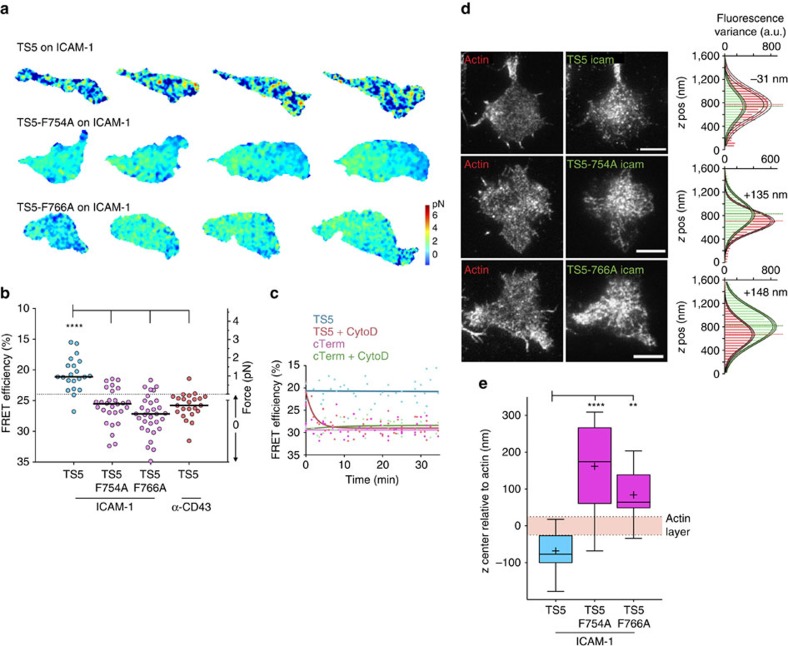
Figure 4. Integrin tension depends on both NPxF motifs.
(a) Representative FRET images taken from movies of migrating Jurkat T cells. Images are corrected for photobleaching. Images are from three independent experiments. (b) Whole-cell FRET levels in migrating Jurkat T cells with 100 ng ml−1 SDF-1α. Individual cells from three independent experiments are shown as circles with median as line. Kruskal–Wallis with Dunn's multiple comparison test of differences between β2-TS5 and the other conditions all had P values<0.0001. (c) Average FRET efficiency of migrating cells treated with 250 nM cytochalasin D at time zero. Each point indicates one cell, imaged only once to avoid complications from photobleaching. Data from two independent experiments are fit to single exponentials. (d) Representative images of focal plane in TIRF z-stacks (50 nm step) of Lifeact-mCherry and TS-mVenus with distribution of fluorescence variance and Gaussian fits with indicated relative difference of the whole-cell distribution. Scale bar, 5 μm. (e) Relative differences of integrin z center to actin after chromatic aberration correction (N=13, 16 and 11). Box plots show the 5–95 percentile range (whiskers) of observations with median as line, mean as plus sign, and 25–75 percentile range boxed. Mean±s.e.m. from left: −68.0±17.1, 161.8±28.9, 84.1±20.5. Kruskal–Wallis with Dunn's multiple comparison test of differences between indicated conditions yielded P values: P<0.0001 and P=0.0013.

