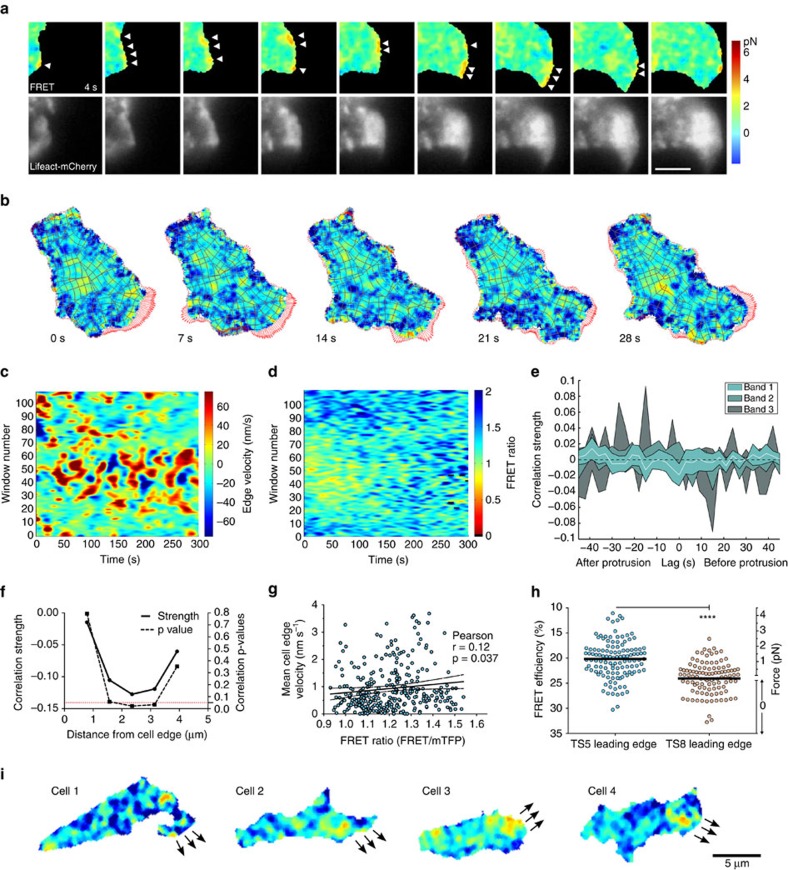
Figure 7. Protrusion can be powered by low force on integrins.
(a) Representative FRET and actin image series on migrating Jurkat T cell taken every 3 s (from >10 independent experiments). Arrowheads point to high force regions that correspond with protrusion in the following frame. Scale bar, 5 μm. (b) Image series from morphodynamics analysis. Each window (gray polygons) is tracked over time. Red arrows show edge velocity vectors. Force scale as in a. (c,d) Example of morphodynamics analysis of protrusion activity (c) and FRET (d). The windows are organized in bands along the cell periphery, with band 1 being all windows along the cell edge, band 2 being the row behind, and so on. Window 55 is near the front of the migrating cell and windows 1 and 110 are at the cell rear. (e) Correlation of instantaneous force versus protrusion over time in TS5 cells. In band 1 there is a weak but significant inverse correlation at zero lag. (f) Correlation of force vs protrusion localization. By averaging windows across the entire movie, a peak correlation value is found at 2.4 μm (band 3) from protruding edge. (g) Distribution of mean force vs mean cell edge velocity over time with Pearson correlation (r and P value shown) and linear regression plotted as solid line with 95% confidence interval shown as dashed lines. N=324 protrusion events. (h) Leading edge quantification. The average force at the leading edge of migrating cells was measured to be 1.5 pN for TS5 cells (N=122) and 0 pN for cTerm cells (N=105). A two-tailed Mann–Whitney test yielded a P value<0.0001. (i) Representative images from migrating TS5 cells showing peak force localization behind the leading edge (from >10 independent experiments). Force scale as in a. Arrows indicate edge movement in next frame.

