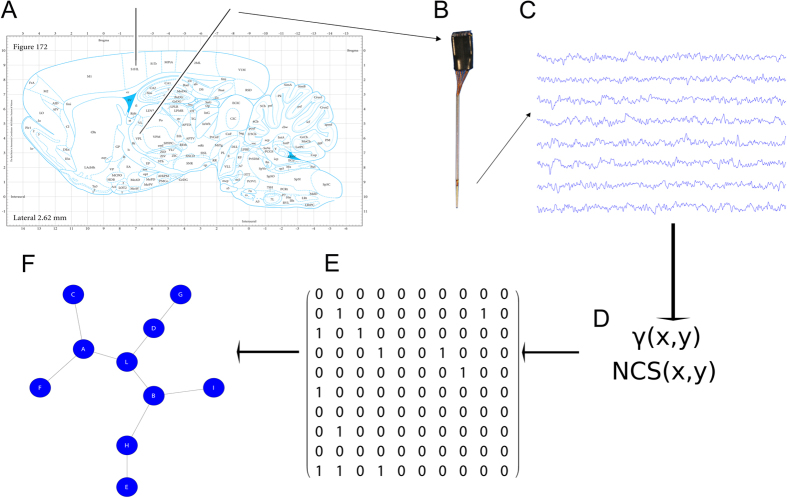
Figure 1. Explanation of the experimental setup.
(A) The illustration of the stereotactile coordinate in the Paxinos’s atlas (reprint permission n. 1982084; Paxinos, G., Watson, C. The Rat Brain in Stereotaxic Coordinates (Third Edition), 172 (Elsevier, 2006)). The two black lines represent the electrode matrices illustrated in (B). (C) A typical time series of the raw extracellular recordings where the functional connections were extracted by means of the functions in (D). (E) A sample of a binary matrix extracted by recordings that corresponds to the graph in (F).

