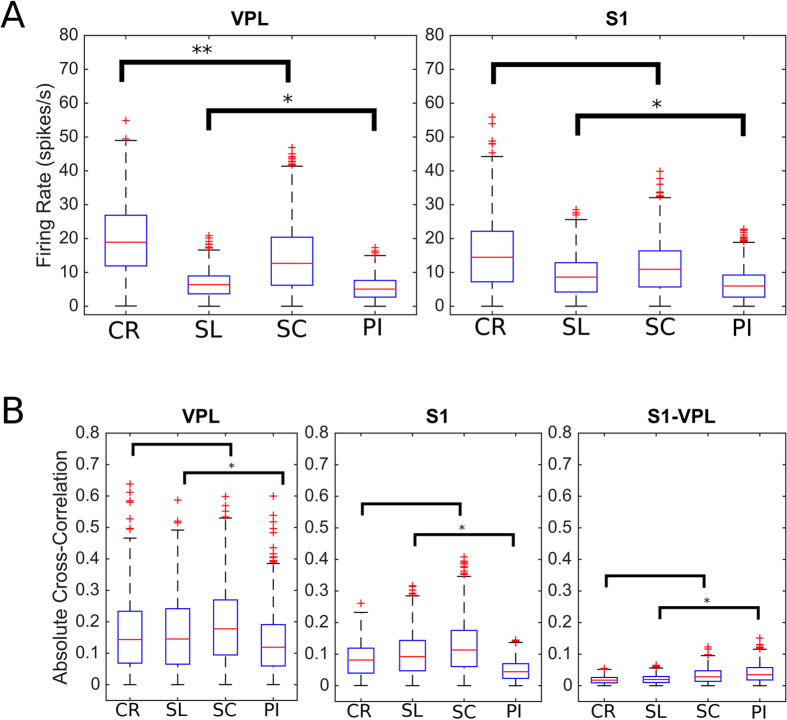
Figure 2. Basilar features of the spiking activity.
(A) The plots show the distribution of firing rate (spike/s) for the recorded neurons of VPL thalamus (left) and for the S1 cortex (right). While in VPL there is a statistical significance between the normal and neuropathic animals, in S1 there is only significance among the neuropathic classes. (B) The cross-correlation estimated between the neurons from VPL (left), S1 (center) and VPL versus S1 (right). Cross-correlation is unable to discriminate control from neuropathic rats. CR represents the control, PI the peripheral injury, the SC the sciatic constriction (Bennet-Xie model) and the SL (Seltzer model) animals. Distributions are visualized as boxplot according to the standard parameters.

