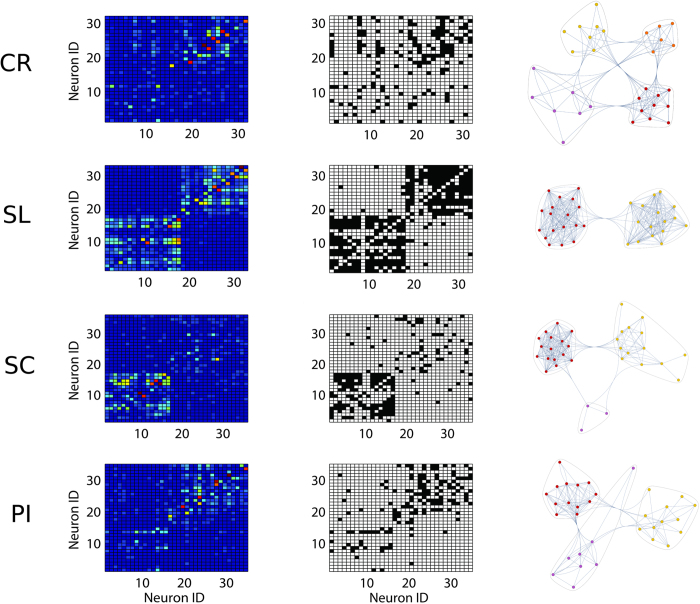
Figure 7. Samples of the spiking activity functional graphs for each experimental condition.
First column reports the raw weighted adjacency matrices while the second column indicates the respective binarized versions. The third column represents the graphs as plotted by the “CommunityGraphPlot” function (Mathematica, http://www.wolfram.com). Remarkable differences are appreciable both among CP conditions and between CR and CP condition. CR represents the control, PI the peripheral injury, the SC the sciatic constriction (Bennet-Xie model) and the SL (Seltzer model) animals.

