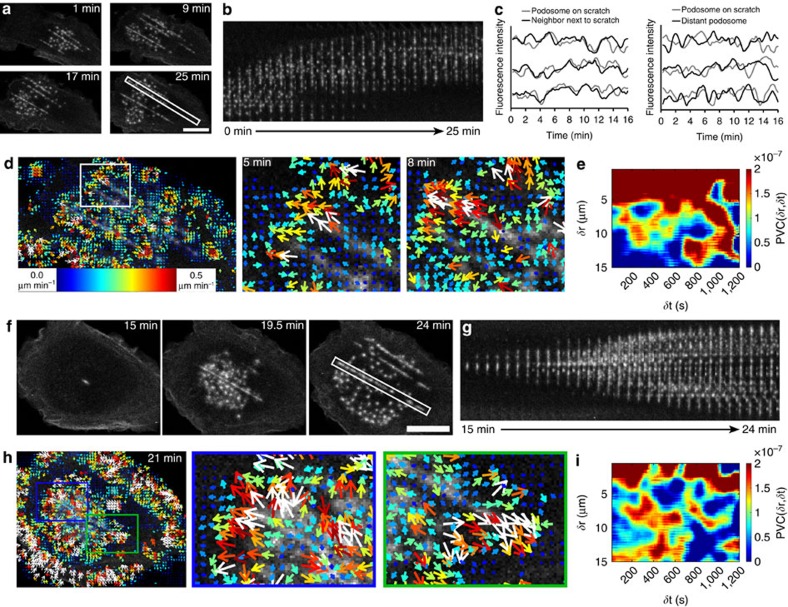
Figure 5. Podosome clusters respond to topographical cues.
(a–e) DCs were transfected with LifeAct-GFP and seeded on a patterned surface. Imaging was performed at a confocal microscope with 15 s frame intervals. Snapshots of the podosome cluster (a) and kymograph from white outlined area (b) show podosome cluster lateral movement. Plots of the GFP intensity fluctuations over time of three representative neighbouring and distant podosome pairs per condition (grey and black lines) are shown in c. Data are normalized to the mean intensity first, followed by normalization to minimum and maximum intensity. The time series was subjected to twSTICS analysis. Image and corresponding vector map plotted onto the immobile filtered version of the image are shown in d. The arrows in the vector maps indicate direction of flow and both the size and colour coding are representative of the flow magnitude. PVC plot (e) shows the spatial and temporal scales of vector correlation during cluster movement. (f–i) DCs were transfected with LifeAct-GFP and seeded on a patterned surface. Imaging was performed at a confocal microscope with 15 s frame intervals. Podosomes dissolution was induced by addition of 2–10 μM nocodazole, which was washed away when the dissolution was complete (not shown). The snapshots (f) and kymograph (g) show the part of the movie after nocodazole washout, when the podosomes reappear. Snapshots of the podosome cluster (f) and kymograph from white outlined area (g) show podosome cluster reformation, time stamps indicate time from the moment of washout. The time series (288 frames) was split into 3 overlapping series of 100 frames, which were subjected to twSTICS analysis. Image and corresponding vector map plotted onto the immobile filtered version of the image are shown in h. The arrows indicate direction of flow and both the size and colour coding are representative of the flow magnitude. The PVC plot (i) shows the spatial and temporal scales of vector correlation during cluster reformation on nocodazole washout. Scale bars, 10 μm.

