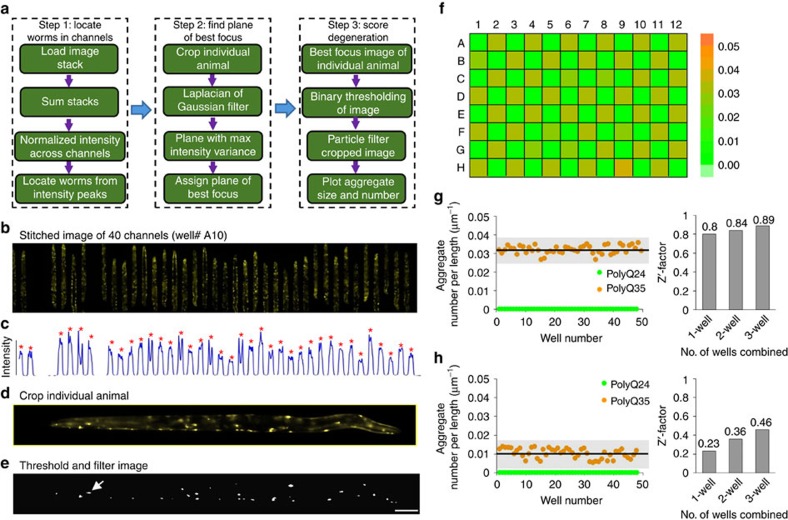
Figure 4. The automated image analysis for estimating the aggregate parameters using high-resolution image stacks and the resulting Z′-factor characterization.
(a) Workflow of the image analysis algorithms that score degeneration in terms of the aggregate parameters from the image stacks. (b) Stitched image of all 40 channels distributed over four FOVs and filled with PolyQ35 animals. (c) Normalized intensity profile across the channels. The red dots mark the channels with animals. (d) A cropped image of a single channel with an animal. (e) Image of the same animal after thresholding and filtering through a particle filter. The arrow indicates one of the aggregates. The scale bar is 100 μm. (f) Heat map of median aggregate number per unit length as measured from a whole 96-well chip loaded with a checker box pattern. (g) Median aggregate number per unit length of each well quantified using the automated algorithms. The panel on the right shows the Z′-factor for 1, 2, and 3-well average values. (h) Median aggregate number per unit length of each well analysed using the lower resolution images (0.13 NA, 4 × objective). The panel on the right shows the Z′-factor for 1, 2, and 3-well average values.

