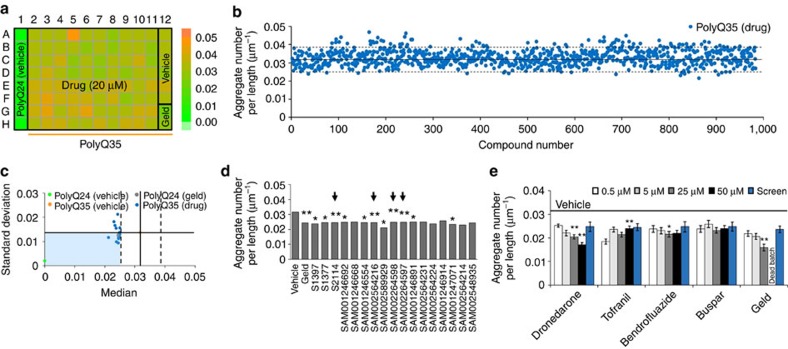
Figure 6. High-throughput screening of FDA-approved compounds.
(a) An example heat map of median aggregate numbers per unit animal length and the loading map. (b) Summary plot of all 983 FDA-approved drug compounds as scored from 14 independent whole-chip experiments. The solid and dotted lines represent, respectively, the median and ±3 × standard deviation of the aggregate numbers per unit length of PolyQ35 animals treated with vehicle. (c) Summary of results from 17 drug compounds with reduced aggregate numbers having median values lower than the 3 × standard deviations of the vehicle control. (d) Statistical significance of these 17 drug compounds as calculated with respect to the vehicle control using two-tailed t-test (n≥33 animals except n=20, 25, and 15 for S1397, S1377, and SAM002589929, respectively). Four of the compounds (S2114, SAM002564216, SAM002264598, and SAM002264597) exhibited statistically significant lower median aggregate numbers per unit length (P<0.005) and are indicated by the arrows. (e) Results of hit validation experiments for these four compounds for animals treated at L1 stage at four different concentrations (0.5, 5, 25, and 50 μM). The blue bars represent the values obtained from the original screen as reference points. Error bars are standard error of the mean. Statistical significance for all different doses for individual compounds was calculated with respect to the lowest concentration using two-tailed, t-test (n≥70 animals except n=37 for Geld 25 μM). The statistical significance values are represented as P<0.05 (*) and P<0.005 (**).

