
Figure 5.
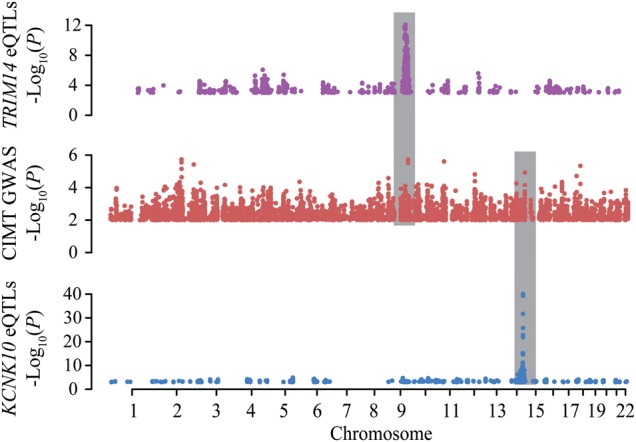
Example of signals identified by Sherlock. Manhattan plots showing the –log10 (P-value) for each SNP arranged by genomic coordinates. Plot shows coordinated signals for the GWAS of CIMT (middle panel), the eQTL signals genome- wide for KCNK10 (bottom panel) and the eQTL signals genome wide for TRIM14 (top panel). Gray bars highlight the regions of interest identified by Sherlock. eQTL panels show all SNPs with P-value <0.001. GWAS panel shows all SNPs with P-value <0.01.