Figure 3.
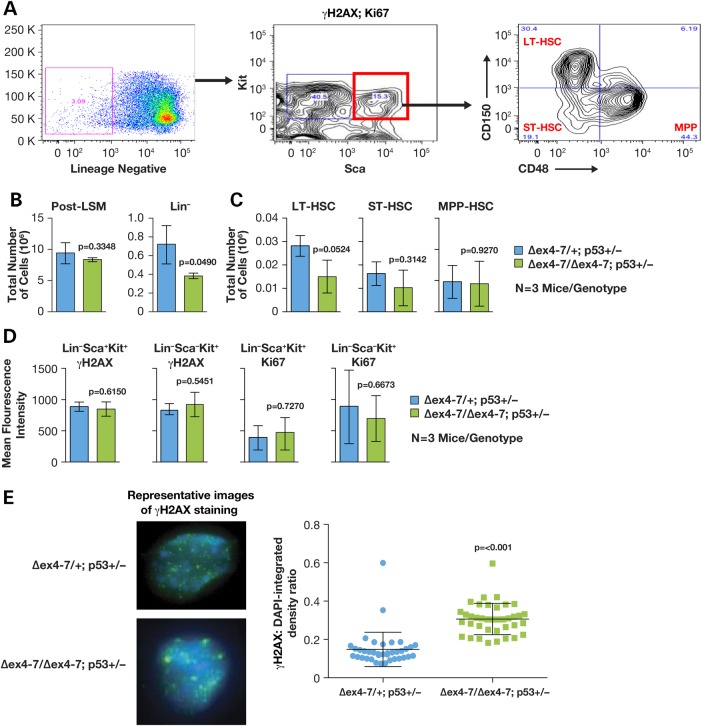
Brca2Δex4–7/Δex4–7;Trp53Ko/+ mice undergo HSC depletion. (A) Representative FACS analysis of bone marrow mononuclear cells stained with antibodies against lineage markers [to identify lineage (Lin) negative cells, c-Kit and Sca (to identify stem and progenitor cells), γH2AX and Ki67. CD150 and CD48 were used to analyze and sort Lin− Sca+ Kit+ cells into long-term (LT), short-term (ST) and multipotent progenitors (MPP). (B) Comparison of total number of mononuclear cells harvested from bone marrow following gradient separation (post-LSM) and percentage of Lin− cells in Brca2Δex4–7/+;Trp53Ko/+ and Brca2Δex4–7/Δex4–7;Trp53Ko/+ (n = 3 mice/genotype). (C) Comparison of LT, ST and MPP cell population, extrapolated as part of total mononuclear cells harvested from whole bone marrow, between Brca2Δex4–7/+;Trp53Ko/+ and Brca2Δex4–7/Δex4–7;Trp53Ko/+ (n = 3 mice/genotype). (D) Comparison of the presence of DNA damage (γH2AX) and proliferation (Ki67) staining in stem (Lin− Sca+ Kit+) and progenitor (Lin− Sca− Kit+) cells of Brca2Δex4–7/+;Trp53Ko/+ and Brca2Δex4–7/Δex4–7;Trp53Ko/+ (n = 3 mice/genotype). (E) Representative images of Brca2Δex4–7/+;Trp53Ko/+ and Brca2Δex4–7/Δex4–7;Trp53Ko/+ FACS sorted MPP cells stained with γH2AX-Alexa488 and DAPI (left panel). Right panel shows ratio of Alexa488:DAPI as a measure of levels of DNA damage present in Brca2Δex4–7/+;Trp53Ko/+ and Brca2Δex4–7/Δex4–7;Trp53Ko/+ MPP cells (n = 2 mice/genotype).

