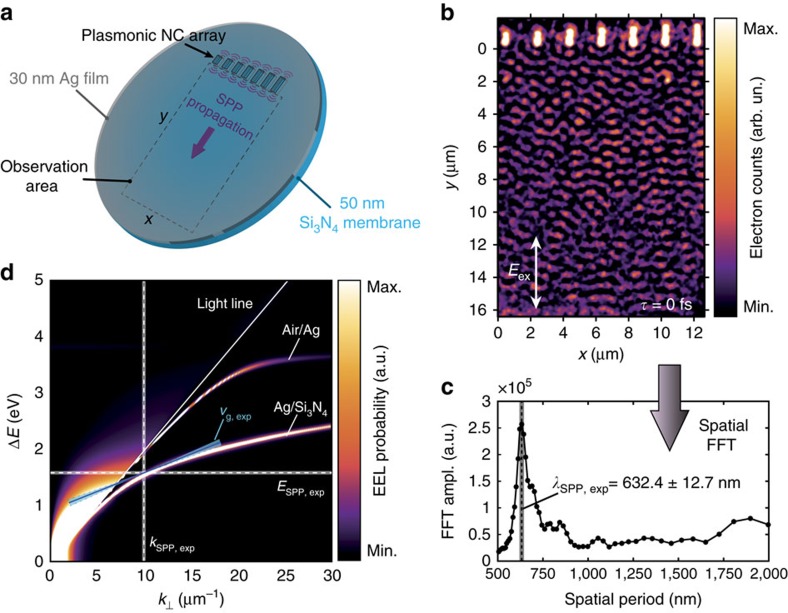
Figure 2. PINEM imaging of SPP interference at a buried interface.
(a) Schematic of the sample and surface plasmon polariton (SPP) propagation experiment. (b) Experimental photon-induced near-field electron microscopy (PINEM) image of the photoinduced plasmonic wave propagating at the buried Ag/Si3N4 interface. The image was recorded at zero delay between electron and laser pulses (τ=0 ps), using only electrons that have gained energy from the plasmonic near-field. The excitation light was polarized parallel to the long axis of the NCs. As the electron and optical pulse durations satisfy Δe>>Δp, the plasmonic interference pattern (PIP) is observed in the entire window at this delay. The linear false colour scale corresponds to relative electron counts. (c) Radially integrated fast Fourier transform (FFT) amplitude of the spatial frequency components contained in the PIP of b as a function of the corresponding spatial period (that is, the radial distance in Fourier space). The position of the singular peak, indicated by the dashed line, corresponds to λSPP,exp, and its uncertainty, calculated from the estimated maximum s.d. of the nm-per-pixel calibration value, is indicated by the shaded grey line. (d) Analytically calculated30 electron energy loss (EEL) probability of 200 keV electrons traversing a 30 nm Ag on 50 nm Si3N4 layer stack (a) at normal incidence, as a function of energy loss ΔE and transversal momentum transfer k⊥ (with respect to the beam direction). Two dispersion branches are observable to the right of the light cone (solid straight line), corresponding to SPP modes propagating along the air/Ag and Ag/Si3N4 interfaces, respectively (Supplementary Fig. 4). Experimental magnitudes are indicated by dashed lines (text), with corresponding uncertainties indicated by thick shaded lines. In particular, the solid blue line indicates the measured SPP group velocity vg,exp (Fig. 3), with the shaded hourglass shape representing the corresponding experimental error.

