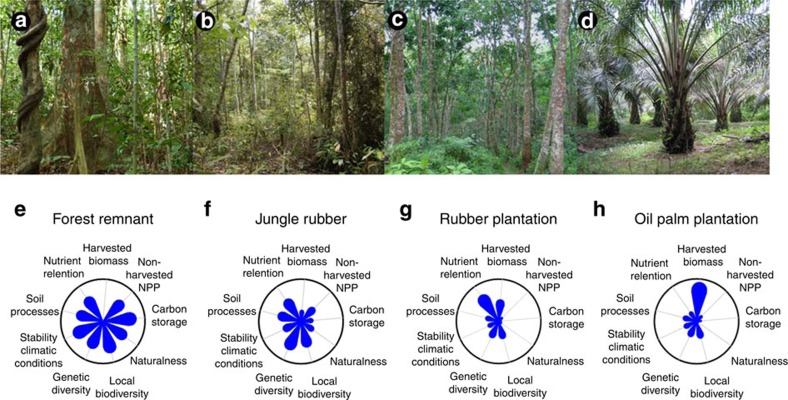
Figure 2. Land-uses and associated ecological functions.
Forest remnants (a,e), jungle rubber (b,f), rubber plantation (c,g) and oil palm plantation (d,h). Ecological functions are represented as flower diagrams. For each function, the minimum (circle centre) is the 5th quantile and the maximum (circle edge) is the 95th quantile of the standardized ecosystem function indicators, observed in a plot of any land-use types. The outer edge of the flower petals indicates the estimate for the aggregate ecosystem function in a given land use relative to these minima and maxima. Because the importance of functions may differ between stakeholders, unweighted values are presented. Photo credits: Katja Rembold (a), and Yann Clough (b–d).

