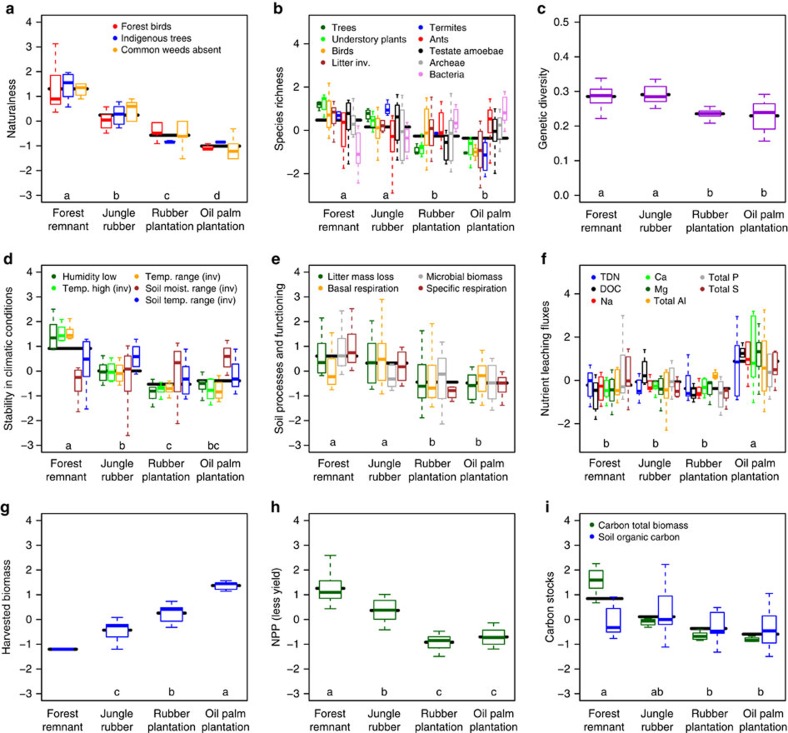
Figure 4. Multiple aggregate ecosystem functions and their indicators.
Naturalness (a), observed local species richness (b), genetic diversity of plants (c), stability in climatic conditions (d), soil processes and functioning (e), nutrient leaching fluxes (f), yield/harvested biomass (g), NPP minus exported harvest (h) carbon stocks (i). Indicators for naturalness (a) are: proportion forest species among bird communities, proportion indigenous tree species, proportion common weed species present. Indicators for biodiversity/species richness (b) are: number of species/OTU of trees, understory plants, birds, litter invertebrates, termites, ants, testate amoebae, archaea and bacteria recorded per plot. Indicator for genetic diversity of plants (c) is Shannon diversity based on 10 individuals for 10 dominant plant species per plot. Indicators for stability in climatic conditions (d) are: lower 5% percentile for air humidity, higher 95% percentile for air temperature (additive inverse), and ranges (additive inverse) between percentiles 5 and 95% for air temperature, soil moisture range and soil temperature. Indicators for soil processes and functioning (e) are: litter mass loss after 6 months, soil microbial biomass, soil basal respiration and soil specific respiration. Indicators for nutrient leaching fluxes (f) are: total dissolved nitrogen (TDN), dissolved organic carbon (DOC), Na, Ca, Mg, total Al, total P and total S. Indicators for carbon stocks (i) are: estimated carbon in total plant biomass and SOC. All variables were standardized to allow joint plotting; summary statistics of raw variables are in Supplementary Table 3. Boxplots indicate the lower quartile, median and upper quartile, with whiskers extending to the most extreme data point that is no more than 1.5 times the interquartile range from the edge of the box. Horizontal bars indicate the estimated mean indicator variable value; letters indicate significant differences (F/Wald-tests; P<0.05) in mean levels of these linear model (c,g,h) and linear mixed model (a,b,d–f,i) estimates between the land-use types. Boxplots within land-use (from left to right) are labelled within the panels (from top to bottom and left to right).

