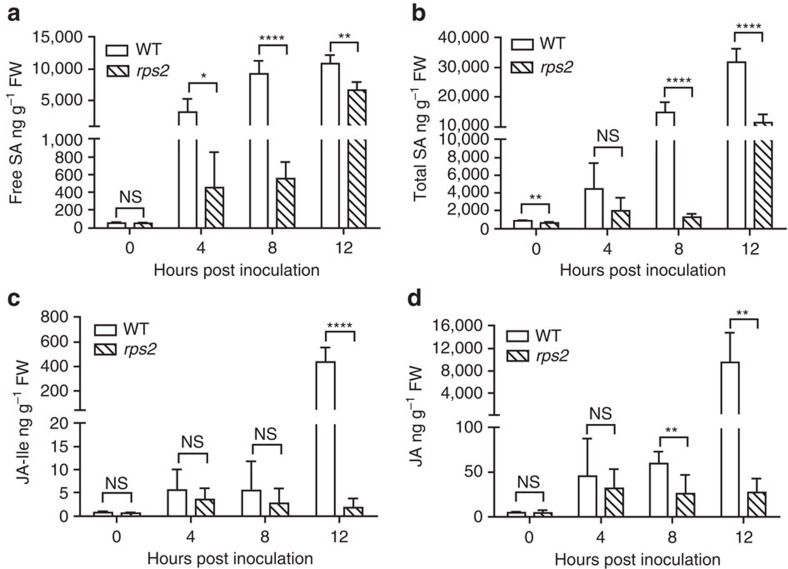
Figure 2. The levels of SA and JA in WT and rps2 during ETI.
Three-week-old WT and rps2 plants were infiltrated with Psm ES4326/avrRpt2 at OD600nm=0.01. Samples were collected at 0, 4, 8, 12 h.p.i. The levels of (a) free SA; (b) total SA; (c) JA-Ile; and (d) JA were measured. Significant difference was detected using Student's t-test. Data are shown as mean±s.d. (n=5–6 biological replicates). All experiments were repeated twice with similar results. *P<0.05; **P<0.01; ****P<0.0001; NS, no significant difference.

