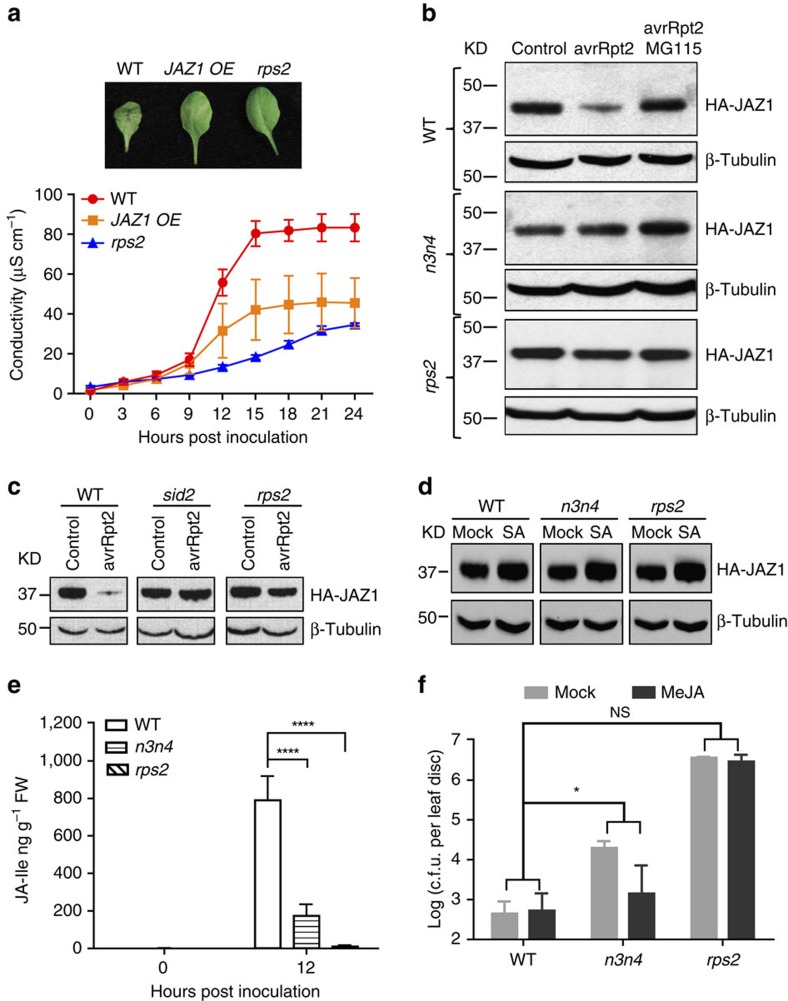
Figure 5. NPR3 and NPR4 promote ETI-induced reduction of JAZ1 level and de novo JA synthesis.
(a) Representative leaves and conductivity measurements of WT, the 35S:HA-JAZ1 overexpressing (JAZ1 OE) transgenic line, and the rps2 mutant. The same methods were used as in Fig. 1c. Data are shown as mean±s.d. (n=3 biological replicates). (b) HA-JAZ1 protein levels were determined in WT, npr3 npr4 (n3n4) and the rps2 mutant 4 h.p.i. with 10 mM MgSO4 (Control), Psm ES4326/avrRpt2 (avrRpt2) or Psm ES4326/avrRpt2 together with 40 μM MG115 (avrRpt2 MG115). (c) HA-JAZ1 protein levels were measured in WT, sid2 and the rps2 mutant 4 h.p.i. with 10 mM MgSO4 (Control), or Psm ES4326/avrRpt2 (avrRpt2). (d) HA-JAZ1 protein levels were determined in WT, npr3 npr4 (n3n4) and the rps2 mutant 4 h after being sprayed with water (Mock) or 1 mM SA. For (b,c,d) the western blots were performed using the HA antibody. β-Tubulin served as a loading control. KD, kilodalton. (e) The JA-Ile levels in WT, npr3 npr4 and rps2 at 0 and 12 h.p.i. with Psm ES4326/avrRpt2 at OD600nm=0.01. Significant difference was detected using Student's t-test. Data are shown as mean±s.d. (n=5–6 biological replicates). (f) Plants were infiltrated with Psm ES4326/avrRpt2 at OD600nm=0.01 and 3.5 h later water (Mock) or 100 μM MeJA (MeJA) was sprayed. Pathogen growth was measured at 1 day post inoculation. Significant difference was detected by two-way ANOVA. Data are shown as mean±s.d. (n=8 biological replicates). All experiments were repeated three times with similar results. *P<0.05; ****P<0.0001; NS, no significant difference.

