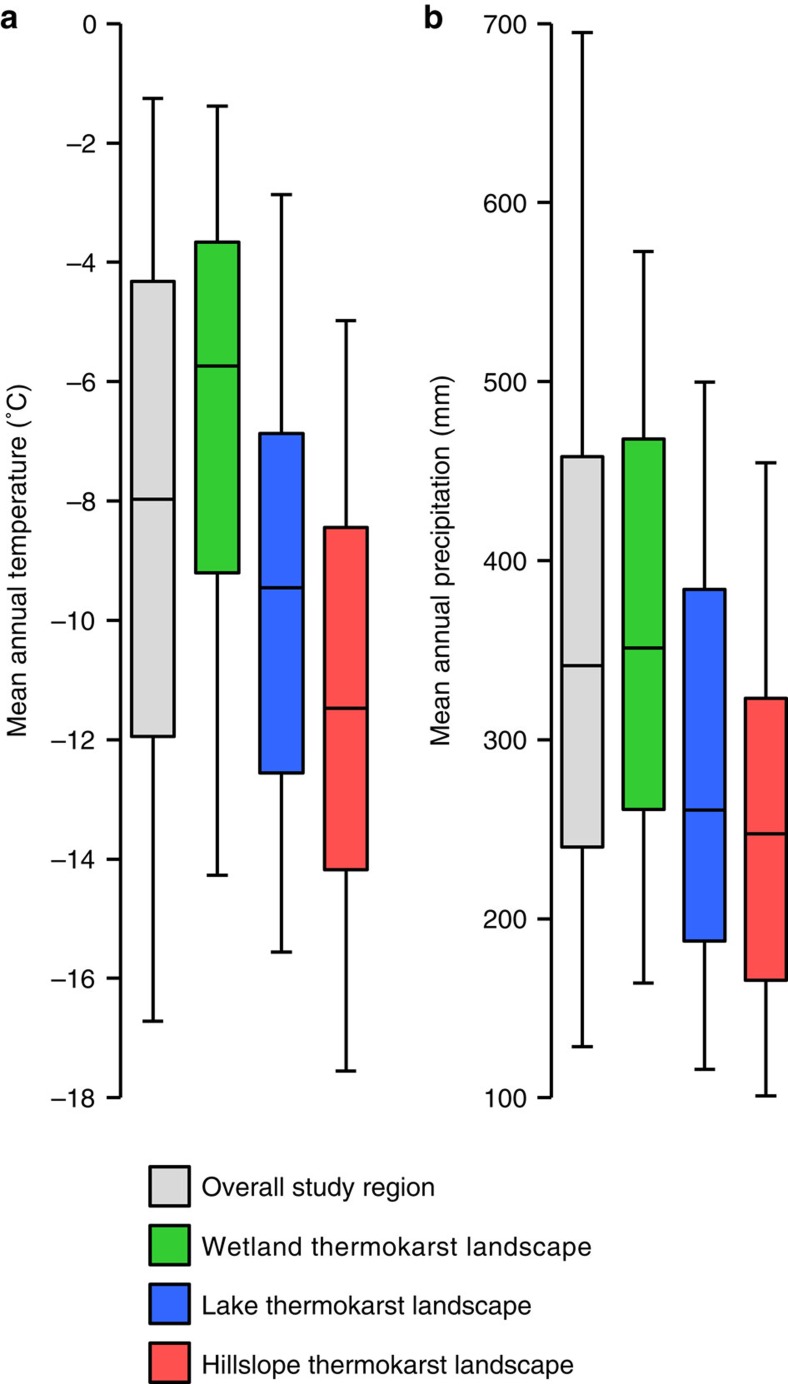
Figure 4. Distribution of thermokarst landscapes under current climate conditions.
Data uses the area and climate for each region in the map of thermokarst landscape distribution. Mean annual (a) air temperature and (b) precipitation estimates for the period 1990–2010 is based on a fused CRU-NCEP re-analysis data set31. Grey boxes indicate the overall study region, while green, blue and red indicate wetland, lake and hillslope thermokarst landscapes, respectively. The boxes represent 25th and 75th percentiles (that is, indicating that 50% of the areas of the overall study region and of the three thermokarst landscape types fall within the box estimates). In addition, the bar indicates the 50th percentile, and whiskers showing 5th and 95th percentiles.

