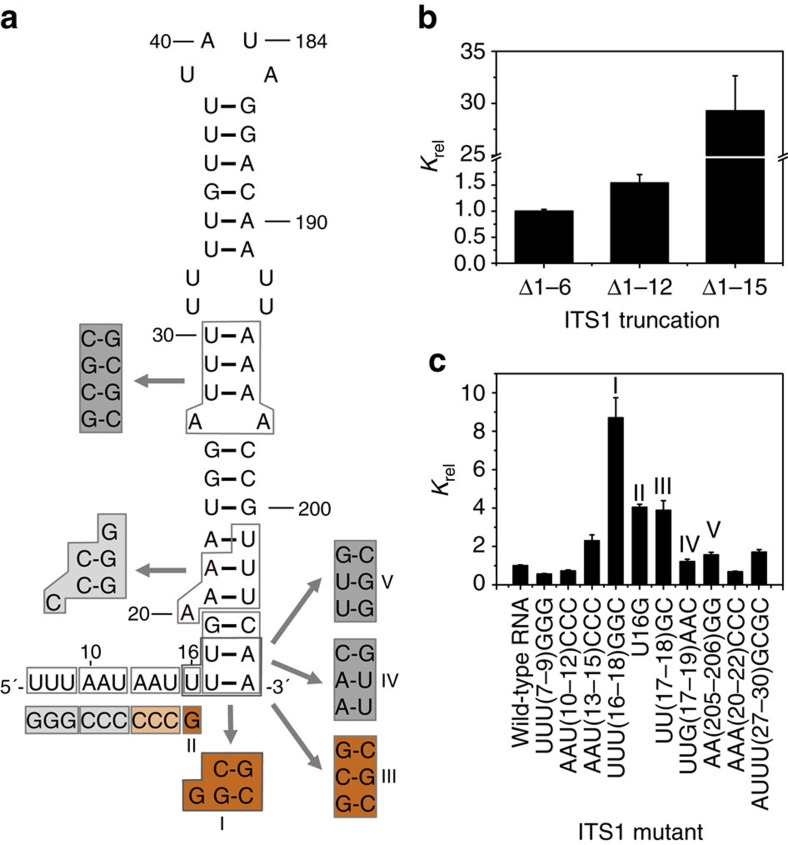
Figure 3. Nop9 recognizes sequence and structural elements of ITS1 RNA.
(a) RNA sequence and secondary structure of ITS1 subdomain A. Mutations tested in c are indicated by the boxed sequences and coloured according to the effect on relative Kd (Krel). Krel was set equal to 1 for Nop9 binding to the ITS1 subdomain A Δ5′1–6, Δ3′ (mean Kd±s.e.m.=11.8±0.4 nM for four technical replicate experiments). Krel>3, dark orange; 2<Krel<3, light orange; 1<Krel<2, dark grey; Krel≤1, light grey. As noted in the text, the mutation at the base of the stem region (I) was probed further with additional mutants (II, III, IV and V). (b) RNA nucleotides 13–15 are critical for Nop9 binding to ITS1 subdomain A. A bar graph created in GraphPad PRISM plots the mean binding affinities of Nop9 and 5′ truncated ITS1 subdomain A RNAs relative to Nop9 binding to ITS1 subdomain A Δ5′1–6, Δ3′ calculated from three technical replicate experiments with error bars representing the s.e.m. (c) RNA nucleotides 13–18 are important for Nop9 binding to ITS1 subdomain A. A bar graph created in GraphPad PRISM plots the mean binding affinities of Nop9 and mutated ITS1 RNAs relative to Nop9 binding to ITS1 subdomain A Δ5′1–6, Δ3′ calculated from three technical replicate experiments with error bars representing the s.e.m. Krel for Nop9 and ITS1 mutants are labelled as in a. For mutations in the stem region, base pairing was maintained by corresponding mutations to the opposite strand. The mean Kd±s.e.m., Krel, and P values are summarized in Supplementary Table 3.

