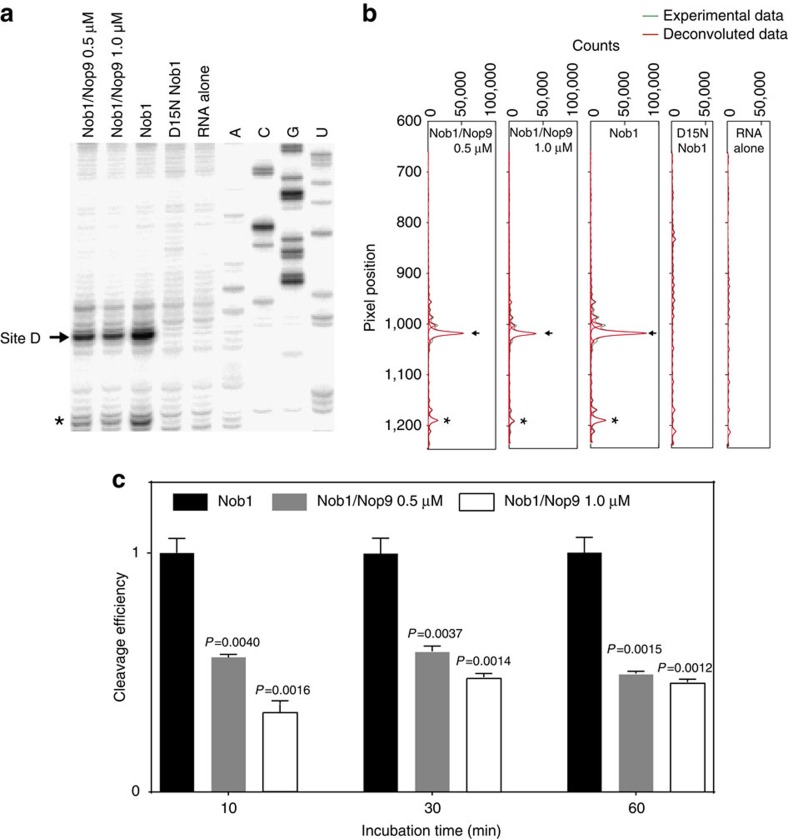
Figure 6. Nop9 reduces Nob1 cleavage efficiency.
(a) Primer extension analysis of Nob1 cleavage. A pre-rRNA substrate containing the 3′ end of 20S pre-rRNA (1 μM) was incubated with Nob1 (3.5 μM) for 60 min in the presence or absence of Nop9 (0.5 or 1.0 μM) and products detected using primer extension analysis. Control reactions with a catalytically inactive Nob1 D15N mutant or RNA substrate alone are included. A representative gel is shown. An arrow indicates a major product with cleavage at site D. An asterisk indicates a minor product at an alternative cleavage site. Sequencing reactions are shown in the right lanes. The full gel is shown in Supplementary Fig. 6a. (b) Profiling of the sequencing gel lanes surrounding site D. SAFA was used to deconvolute the sequencing gel in a. (c) Nob1 cleavage efficiencies at different time points and concentrations of Nop9. Cleavage efficiencies were calculated as the ratio of site D cleavage product to total RNA and the efficiency of cleavage by Nob1 alone was set to 1 for each time point. The mean cleavage efficiencies±s.e.m. for Nob1 were 1.15±0.06% at 10 min, 3.54±0.23% at 30 min and 7.73±0.50% at 60 min. Bar graphs created in GraphPad PRISM plot the means calculated from three technical replicate experiments with error bars representing the s.e.m. The significance of the cleavage efficiencies in the presence of Nop9 relative to Nob1 cleavage alone was assessed by an unpaired, two-sided t-test, and P values are indicated.

