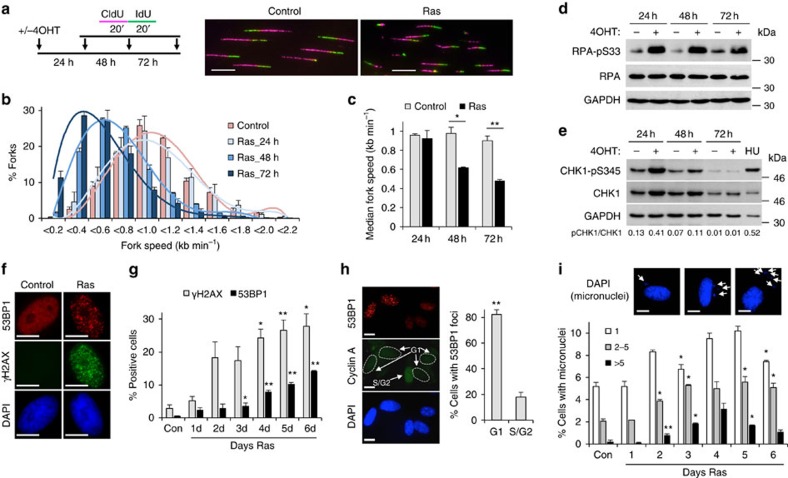
Figure 3. HRASV12 causes replication stress and genomic instability.
(a) Top: DNA fibre labelling was performed in BJ-HRASV12 cells after RAS induction for 24, 48 and 72 h. Bottom: representative images of DNA fibres after 72 h RAS induction. (b) Distributions of replication fork speeds after RAS induction. N=3. (c) Median replication fork speeds after RAS induction. N=3. (d) Protein levels of phospho-S33 RPA32, RPA32 and GAPDH after RAS induction. (e) Protein levels of phospho-S345 CHK1, CHK1 and GAPDH after RAS induction. Hydroxyurea (HU, 2 mM for 24 h) was used as a positive control. (f) Representative images of γH2AX and 53BP1 foci after RAS induction for 96 h. (g) Percentages of cells containing more than 8 γH2AX or 53BP1 foci after RAS induction for 96 h. N=2. Asterisks compare with control. (h) Cell cycle distribution of 53BP1-positive cells after 96 h RAS induction as determined by co-staining with Cyclin A. Right panel: representative images; left panel: quantification. N=3. (i) Representative images of cells with micronuclei and percentages of cells containing micronuclei after RAS induction for 1–6 days. N=2. Asterisks compare with control. Means ±s.e.m. (bars) are shown. Student's t-test, *P<0.05 and **P<0.01. Scale bars, 10 μm.

