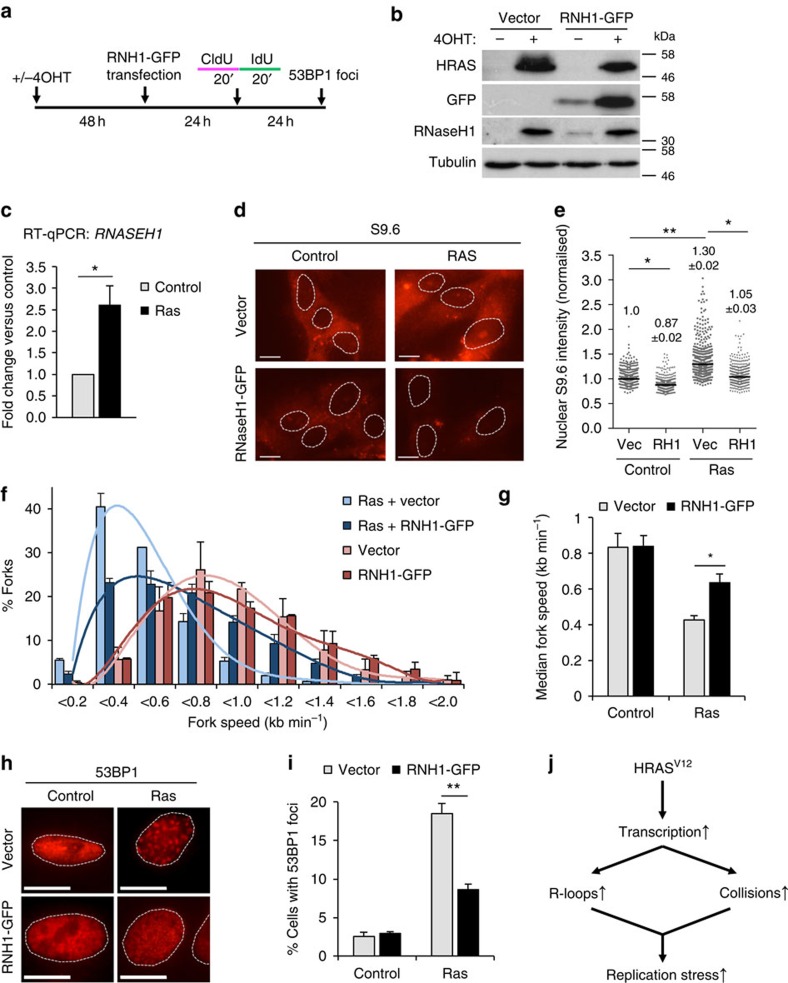
Figure 5. HRASV12 induces replication stress through R-loop formation.
(a) After RAS induction for 48 h, BJ-HRASV12 cells were transfected with pCMV6-AC-RNaseH1-GFP or empty vector and processed for DNA fibre analysis or 53BP1 foci staining after 24 or 48 h. (b) Protein levels of HRAS, GFP, RNaseH1 and TUBULIN (loading control) 72 h after RAS induction and 24 h after transfection with pCMV6-AC-RNaseH1-GFP. (c) RNASEH1 mRNA quantification by quantitative reverse transcriptase–PCR after 72 h RAS induction. RNASEH1 mRNA levels were normalized to GAPDH and control. (d) Representative images of S9.6 immunostaining ±pCMV6-AC-RNaseH1-GFP 72 h after RAS induction. (e) Quantification of nuclear S9.6 intensity ±pCMV6-AC-RNaseH1-GFP 72 h after RAS induction. N=3. (f) Distribution of fork speeds ±pCMV6-AC-RNaseH1-GFP 72 h after RAS induction. N=3. (g) Median replication fork speeds ±pCMV6-AC-RNaseH1-GFP 72 h after RAS induction. N=3. (h) Representative images of cells with 53BP1 foci, ±pCMV6-AC-RNaseH1-GFP 96 h after RAS induction. (i) Percentage of cells displaying more than 8 53BP1 foci, ±pCMV6-AC-RNaseH1-GFP 96 h after RAS induction. N=3. (j) Model of how HRASV12 causes replication stress via increasing transcription. Means ±s.e.m. (bars) are shown. Student's t-test, *P<0.05 and **P<0.01. Scale bars, 10 μm.

