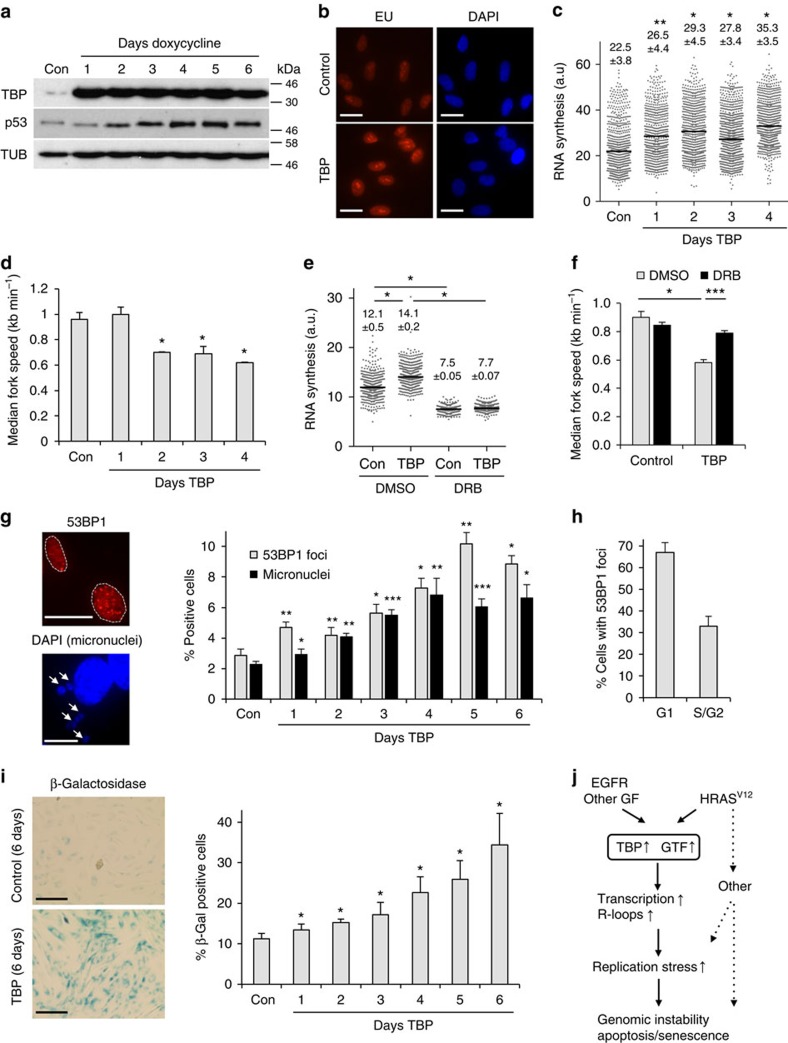
Figure 7. TBP overexpression causes replication stress and senescence.
(a) Protein levels of TBP, p53 and TUBULIN (loading control) in BJ-TBPind cells treated with doxycycline for 1–6 days, to induce TBP overexpression. No doxycycline was used as a control. (b) Nascent RNA synthesis as measured by EU incorporation after TBP induction for 3 days. Scale bars, 10 μm. (c). Quantification of nuclear EU intensity after TBP induction for 1–4 days. N=4 (con, day 1, 2 and 4), N=5 (day 3). (d) Median replication fork speeds in after TBP induction. N=2 (day 1, 2 and 4), N=4 (con, day 3). Asterisks compare with control. (e) Nascent RNA synthesis as measured by EU incorporation in cells treated with DRB or dimethylsulfoxide (DMSO) (control) for 100 min, 72 h after TBP induction. N=3. (f) Median replication fork speeds in BJ-TBPind cells treated with DRB 72 h after TBP induction. N=3. (g). Percentage of cells displaying more than eight 53BP1 foci or micronuclei after TBP induction. Right panel: representative images of cells with 53BP1 foci and micronuclei. Asterisks compare with control. N=2–7. (h) Cell cycle distribution of 53BP1-positive cells 96 h after TBP induction as determined by co-staining with Cyclin A. N=2. (i) Representative images and percentages of β-galactosidase staining after TBP induction for 1–6 days. Scale bars, 100 μm. (j) Model of how HRASV12 and other growth factor oncogenes such as epidermal growth factor receptor (EGFR) induce replication stress by increasing transcription through TBP and other transcription factors. Additional mechanisms, such as reactive oxygen species, may also contribute to HRASV12-induced DNA damage. Means ±s.e.m. (bars) are shown. Student's t-test, *P<0.05, **P<0.01 and ***P<0.001.

