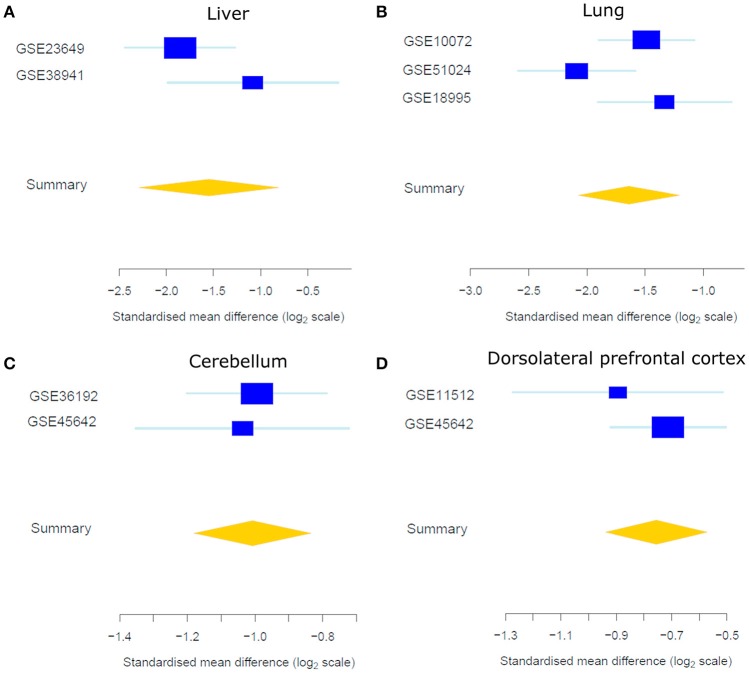
Figure 5.
Forest plots of the standardized mean difference of KDM6A expression showing higher expression in females in the liver (A), lung (B), CB (C), and DLPFC (D). Each blue box is representative of the study size in each data set and horizontal lines are standard error. The yellow diamond represents the overall gene summary for KDM6A in each tissue.

