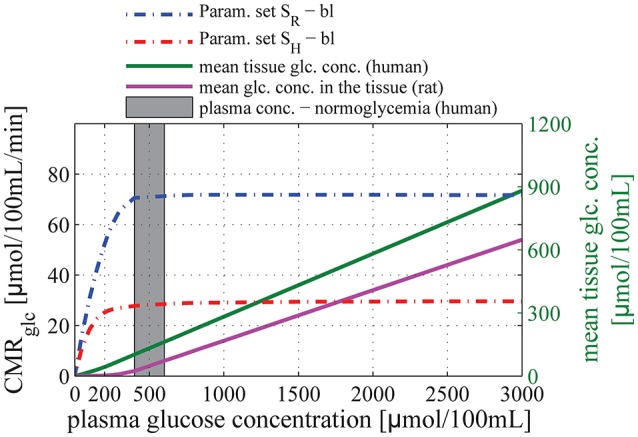
Figure 3.

Relation between glucose concentration in plasma and CMRglc in baseline condition. The purple and green solid lines correspond to the mean glucose concentration in the tissue (input) as a function of arterial glucose concentration according to relations (13) and (14), based on experimental studies by Dienel et al. (1991) and Gruetter et al. (1998), respectively. The blue dotted-dashed line corresponds to predictions obtained using parameter set SR: vmax_t = 136 μmol/100 mL/min and KT = 150 μmol/100 mL_brain. The red dotted-dashed line corresponds to parameter set SH: vmax_t = 68 μmol/100 mL/min and KT = 50 μmol/100 mL_brain. The gray area corresponds to conditions of normoglycemia in humans (plasma glucose concentration ranging from 400 to 600 μmol/100 mL).
