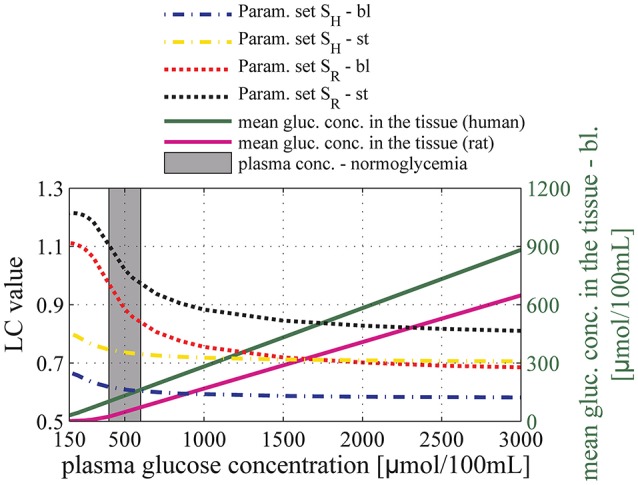
Figure 6.

Relation between glucose concentration in plasma and the lumped constant (LC) for FDG in baseline condition (dashed-dotted line) and during stimulation (dotted line). The black and the red lines correspond to predictions obtained using parameter set SR: vmax_t = 136μmol/100mL/min and KT = 150μmol/100 mL_brain. The yellow and the blue lines correspond to predictions obtained using parameter set SH: vmax_t = 68 μmol/100 mL/min and KT = 50 μmol/100 mL_brain. The purple and green solid lines correspond to the mean glucose concentration in the tissue (input) as a function of arterial glucose concentration according to relations (13) and (14), based on experimental studies by Dienel et al. (1991) and Gruetter et al. (1998), respectively. The gray area corresponds to conditions of normoglycemia in humans (plasma glucose concentration ranging from 400 to 600μmol/100 mL). bl, baseline condition; st, stimulation.
